

Running a small clothing store means constantly guessing when to reorder. You place an order expecting delivery in two weeks, then it shows up in four. Next time you order early to compensate, and the shipment arrives in eight days, leaving you with excess stock eating up cash flow.
Most indie retailers handle this unpredictability by keeping way too much inventory "just in case" or scrambling with rush orders when popular items run out. Both approaches hurt margins—overstock ties up capital while stockouts lose sales.
The real issue isn't that suppliers are unreliable. It's that small retailers rarely track delivery variance systematically. Without actual data on how much lead times fluctuate, you can't set proper reorder points. You're essentially planning inventory blindfolded.
The hidden math behind stockouts and overstock
Every supplier has an average lead time, but that average hides massive swings. Your main denim supplier might average 14 days, but looking closer reveals deliveries ranging from 9 to 23 days. That 14-day variation completely changes how much safety stock you need.
Here's what typically happens in a small boutique:
You sell roughly 15 units of a popular sweater weekly. The supplier quotes 10-day lead time. Simple math says reorder when you hit 22 units (15 units × 1.5 weeks). Except last month's order took 18 days. Now you're explaining to customers why their size is out of stock for a week.
Or the opposite problem hits. You bump up the reorder point to 35 units after that late delivery. The next three orders arrive in 8 days. Now you're sitting on an extra 100 units across various SKUs—roughly $3,000–4,000 in tied-up capital that could have gone toward fresh inventory or marketing.
The variance gets worse with seasonal items. A supplier delivering fall jackets might be consistent in August (7–9 days) but completely unpredictable in October (8–25 days) when every retailer is ordering simultaneously. Using the same reorder point year-round guarantees problems.
Why traditional inventory formulas fail small retailers
Standard inventory management assumes consistent sales data, reliable suppliers, and decent software. Small clothing stores rarely have any of those. Your "system" is probably a mix of supplier emails, handwritten notes, and maybe a basic spreadsheet.
Take control of your clothing store operations.
Werzly helps you manage stock, process orders, and engage customers effortlessly.
- Unified inventory and order management
- Automated customer notifications
- Sales and stock analytics
No credit card required
The textbook safety stock formula requires:
-
Standard deviation of demand
-
Standard deviation of lead time
-
Service level targets
-
Accurate historical data
Good luck calculating standard deviation when you sold 3 units one week and 18 the next because of a local event. Or when your supplier is a small workshop that closes randomly for holidays you've never heard of.
Even if you could run these calculations, they assume normal distribution—that delays and early deliveries balance out symmetrically. In reality, suppliers rarely deliver early but frequently deliver late. A two-day early delivery doesn't offset a two-week delay when customers are already waiting.
A practical spreadsheet system that actually works
After watching dozens of small retailers struggle with complex formulas, a dead-simple system captures 80% of the value with minimal effort.
Create one spreadsheet with five columns:
-
Order date
-
Expected delivery date (what supplier quoted)
-
Actual delivery date
-
Days difference
-
Rolling notes
Every single order goes in this sheet. No exceptions. Even small restocks, even rush orders. This becomes your reality check against supplier promises.
After tracking 8–10 orders per supplier, patterns emerge pretty clearly. That "reliable" accessories vendor? Consistently 3–4 days late. The new supplier promising 7-day delivery? They've hit it exactly once in six orders.
For safety stock, skip the statistics. Use this simplified approach:
Safety Stock = (Maximum delay in days × Daily sales rate) × 0.7
The 0.7 factor prevents overcompensation. If your worst delay was 10 days and you sell 2 units daily, you'd hold 14 units of safety stock—not the full 20.
Your reorder point becomes:
Reorder Point = (Average lead time × Daily sales) + Safety Stock
This gives you coverage for typical variance without tying up excessive capital in edge cases.
Here's a simple workflow for entering orders and updating reorder points.
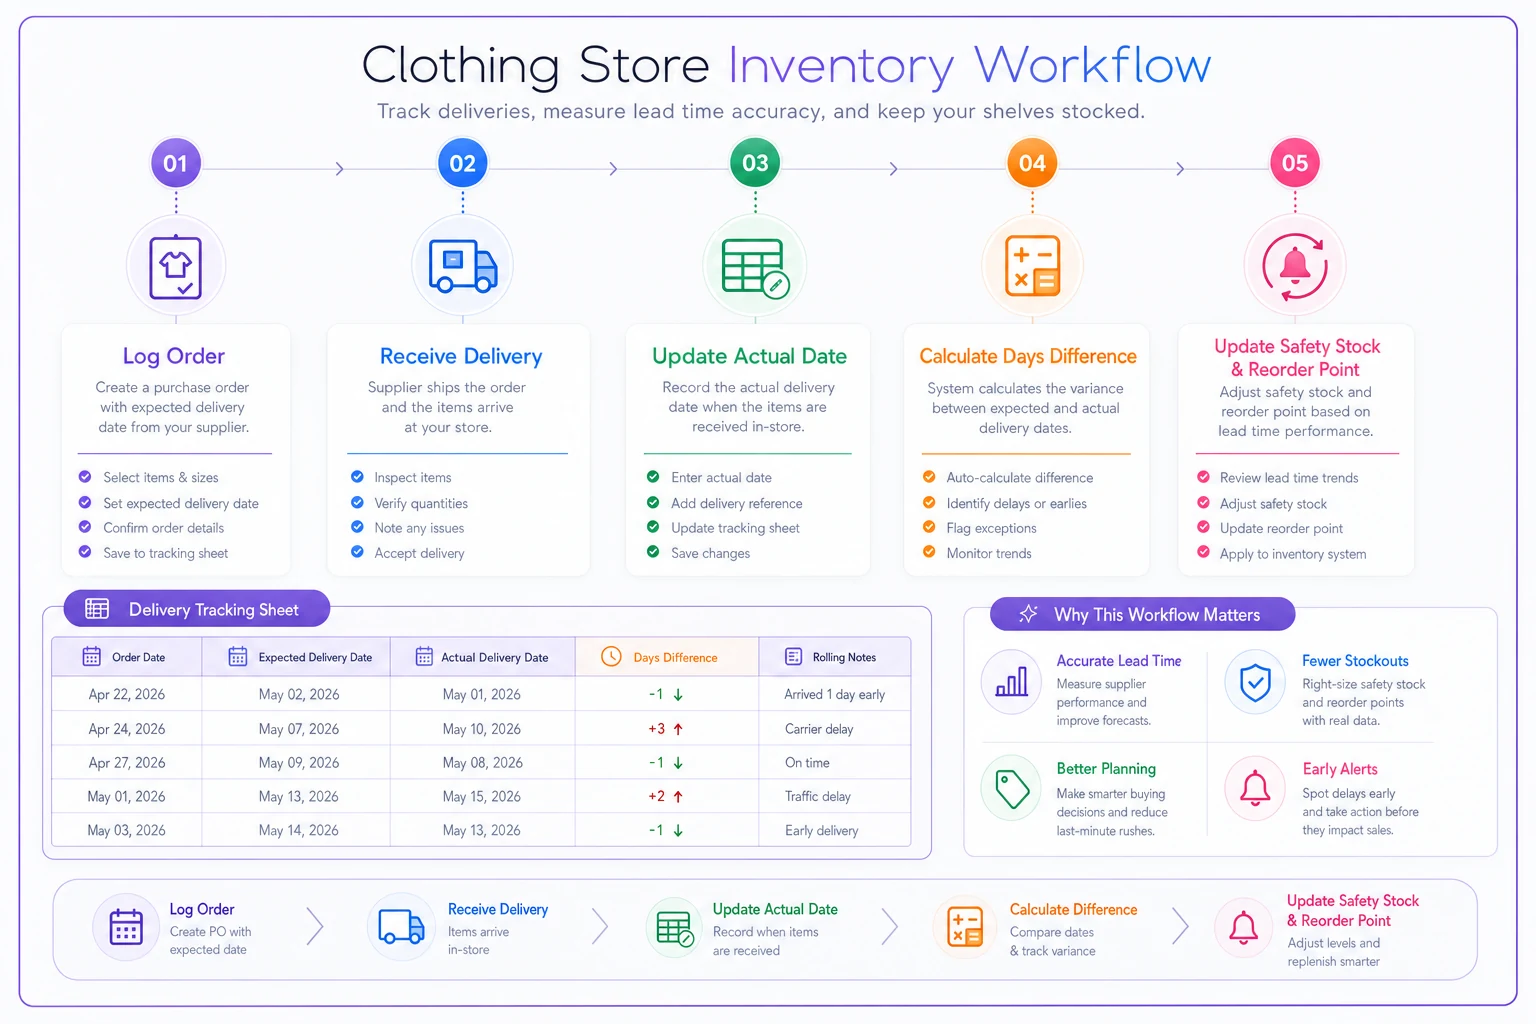
Log even the smallest restocks — they quickly reveal whether a supplier's "one-off" delay is a pattern.
After tracking and using the simplified formulas, you can set reorder points that cover common delays without hoarding inventory.
Monthly recalibration based on real data
The power comes from updating these numbers monthly, not setting them once and forgetting. Every month, spend 20 minutes recalculating based on your last 10 deliveries per supplier.
Here's what a monthly review looks like for one SKU:
| Metric | Month 1 (October) | Month 2 (November) |
|---|---|---|
| Average lead time | 12 days | 15 days (holiday slowdown) |
| Longest delay | 5 days | 8 days |
| Daily sales | 1.5 units | 2.1 units (seasonal uptick) |
| Safety stock | 5 units | 12 units |
| Reorder point | 23 units | 44 units |
Notice how dramatically the reorder point shifted. Keeping October's trigger through November would have guaranteed stockouts during the holiday rush. This isn't sophisticated analytics—it's just paying attention to what actually happened.
Adjustments for low-volume SKUs
Low-volume items break traditional formulas completely. When you sell 1–2 units monthly, daily sales rates become meaningless. Standard deviation calculations produce nonsense.
For these items, switch to a min/max approach:
Minimum stock = 1 month of sales Maximum stock = 3 months of sales Reorder trigger = When you hit minimum
A $200 dress that sells once a month doesn't need complex math. Keep 1–3 units. Reorder when you sell one. The simplicity prevents both stockouts and unnecessary cash drain.
For items with erratic demand—selling zero units for two months then 5 in a single week—track buying patterns, not just sales:
-
Customer requests (even when you're out of stock)
-
Times you've actually shown the item
-
Special events driving demand
-
Social media interest
These leading indicators matter more than historical sales for unpredictable items.
Supplier-specific adjustments that prevent surprises
Local workshop supplier:
-
Base lead time
8 days
-
Vacation periods
Late December, mid-August
-
Variance
±2 days normally, +15 days during closures
-
Strategy
Triple safety stock before known shutdowns
Overseas manufacturer:
-
Base lead time
21 days
-
Customs risk
Roughly 1 in 5 shipments delayed 7–10 days
-
Variance
-3 to +10 days
-
Strategy
Always assume 25 days minimum, reorder earlier on critical items
Drop-ship supplier:
-
Base lead time
5 days
-
Stock-out risk
High (they don't hold inventory)
-
Variance
Either 5 days or indefinite delay
-
Strategy
Keep backup options, never rely solely on them for popular items
Build supplier profiles into your tracking to reflect these differences and prevent nasty surprises.
When automated tracking beats spreadsheets
This manual system works well until you hit around 50–75 SKUs with regular movement. Beyond that, monthly recalculation becomes a full day's work. You'll start skipping updates, the data gets stale, and you're back to guessing.
Signs you've outgrown spreadsheets:
-
Monthly updates take 3+ hours
-
You're tracking 100+ active SKUs
-
Multiple staff need access simultaneously
-
Calculation errors creep in regularly
-
You need daily rather than monthly adjustments
At this point, operational software with built-in lead time tracking starts making sense. Modern platforms automatically log delivery dates, calculate variance, and adjust reorder points without you having to touch a spreadsheet. Some will even factor in promotional calendars and seasonal shifts you'd probably miss manually.
The transition doesn't need to be dramatic. Start by moving your top 20% of SKUs—the ones that actually drive cash flow—into software. Keep the spreadsheet for slow movers and newer products where you're still figuring out patterns.
Common mistakes that sabotage reorder accuracy
The biggest error is treating all delays equally. A two-week delay on beach coverups in March is catastrophic. The same delay on winter scarves in May means almost nothing. Weight your safety stock calculations by seasonal importance.
Another mistake is ignoring partial shipments. Your supplier delivers 60% of an order on time and the rest trickles in over two weeks. Recording that as one delayed order understates the real problem. Track each portion separately to see what's actually happening.
Watch out for false precision too. Calculating reorder points to decimal places (23.7 units) when your sales swing 50% week to week is pointless. Round to reasonable numbers and focus on catching the big misses.
Many retailers also forget order minimums. Your math says reorder 15 units, but the supplier requires 30-unit minimums. Now you need different logic—maybe combining SKUs or adjusting order frequency rather than quantity.
A real boutique's before and after
Here's how this played out for a 900-square-foot boutique selling contemporary women's clothing:
Before tracking:
-
Ordering based on feel and visual stock checks
-
Roughly $18K in excess inventory
-
3–4 stockouts weekly on popular items
-
Panicked rush orders twice a month
After 3 months of spreadsheet tracking:
-
Identified that main supplier averaged 11 days (not the quoted 7)
-
Discovered accessories supplier had a 40% on-time rate
-
Reduced excess inventory to around $8K
-
Stockouts dropped to 3–4 monthly
-
Rush orders nearly eliminated
The owner spent maybe 2 hours monthly on tracking and recalculation. The freed-up cash funded a social media advertising test that drove a 20% sales increase.
The stockout reduction mattered even more than the cash improvement. Regular customers stopped running into that frustration of items being unavailable. They started trusting that popular pieces would actually be in stock—fewer "backup purchases" from competitors.
Making this sustainable for a small team
The key to maintaining this system is folding it into existing workflows rather than treating it as separate work:
-
Log deliveries immediately when unpacking shipments
-
Update the spreadsheet while doing weekly orders
-
Recalculate during month-end financial review
-
Share updates in regular team meetings
If you have staff, assign one person as the reorder point of contact. They own the spreadsheet, track patterns, and flag issues before they become emergencies. This prevents the common problem of multiple people sort-of tracking things with no one really responsible.
Keep the spreadsheet visible—literally print key metrics and post them in your back office. When everyone sees that Supplier X is averaging 15-day delays, they stop promising customers unrealistic timelines.
For seasonal planning, run a quarterly deep dive. Look at year-over-year patterns, upcoming holidays, and planned promotions. Adjust safety stock preemptively rather than reacting after problems hit.
The bigger picture: from reactive to predictive
This manual tracking system isn't the end goal—it's the foundation for smarter inventory decisions. Once you have 6–12 months of real data, patterns become predictable. You'll spot that delays cluster in December, that certain product categories need more buffer, that Tuesday orders somehow arrive faster than Friday orders.
Eventually, this pushes you toward more capable tools. AI-powered inventory management can detect patterns humans miss—correlations between weather and delivery delays, or between social media trends and demand spikes. But you can't skip straight to automation. Without first understanding your actual variance through manual tracking, even good software just automates bad assumptions. The spreadsheet phase teaches you what questions to ask and what patterns actually matter for your specific business.
Start simple. Track every delivery for one month. Calculate basic safety stock for your top 10 SKUs. Update reorder points based on actual data, not supplier promises.
The goal isn't perfection—it's replacing guesswork with good-enough data that prevents the worst inventory mistakes. For most small clothing retailers, that's plenty to see real improvement in both cash flow and customer satisfaction.
Ready to elevate your apparel business?
Join 2,000+ retailers using Werzly to streamline operations, increase sales, and deepen customer loyalty.