



Most forecasting advice was written for businesses that sell the same thing every week. Apparel doesn't work that way. You're dealing with color runs, size curves, seasonal drops, and one-off buys that move six units total. The math that works for a grocery store or a hardware distributor falls apart the moment you apply it to a rack of dresses that peaks for eleven weeks and then dies.
That mismatch is why so many small apparel stores bounce between two failure states: shelves full of stuff nobody wants, and empty pegs during the exact weeks demand spikes. Both are expensive. Both come from the same root cause — treating every SKU with the same forecasting logic when your inventory clearly isn't the same kind of thing.
This is a system-level article, not a list of reorder tips. The goal is to show how segmentation, safety-stock rules, lead-time reality, and a monthly review cadence fit together into something you can actually maintain without a full-time planner. There are downloadable templates at the end you can adapt.
Why forecasting breaks in apparel specifically
The core problem with inventory forecasting for small apparel stores is that your demand signal is noisy and your history is thin. A staple SKU like a black crew tee might sell 8–15 units a week — steady enough to model. But most of your assortment isn't that. It's fashion product with a short life, no repeat history, and demand shaped by weather, promotions, and whatever a customer saw on their phone that morning.
Here's what plays out in real operations. A store owner looks at last month's sales, sees a SKU sold 4 units, and reorders 4. Simple enough. Except that SKU sold 4 because there were only 6 in stock and two sizes were already gone. The "demand" number is really a supply-constrained number. You're forecasting off a ceiling you created yourself, and it quietly locks you into perpetual understocking on your best sellers.
The opposite happens with slow movers. A SKU sold 1 unit last month, so the owner assumes it's dying and marks it down. But that SKU is a low-velocity basic that reliably moves 1–2 a month all year. Marked down early, it loses margin it never needed to lose. The forecast treated normal low volume as a warning sign.
The pattern underneath both mistakes is identical: one forecasting rule applied to SKUs that behave completely differently. Fixing that starts with segmentation, not spreadsheets.
Segment first, forecast second
You can't forecast a rack of mixed product with a single method. You need to sort SKUs into behavioral groups first, then apply different logic to each group. Most stores over-complicate this. Four segments cover the vast majority of apparel inventory.
Take control of your clothing store operations.
Werzly helps you manage stock, process orders, and engage customers effortlessly.
- Unified inventory and order management
- Automated customer notifications
- Sales and stock analytics
No credit card required
| Segment | What it looks like | Forecast method | Safety stock approach |
|---|---|---|---|
| Core / Never-out | Basics you always carry (black tees, denim staples). Steady weekly velocity. | Trailing average, adjusted for trend | Higher — you never want a zero |
| Seasonal | Outerwear, swim, holiday. Predictable curve, predictable dates. | Curve-based, anchored to prior-season shape | Front-load early, taper hard late |
| Fashion / Short-life | Trend pieces, limited runs. Little to no history. | Analog forecasting (compare to similar past items) | Minimal reorder; sell what you bought |
| Long-tail / Low-volume | SKUs selling 0–2 units a month. Big chunk of your SKU count. | Don't forecast individually — pool by category | Reorder on threshold, not projection |
That last row is where most small stores waste enormous effort. Trying to forecast a SKU that sells one unit every six weeks is statistically meaningless — the "forecast" is basically a coin flip. Long-tail SKUs tend to make up 40–60% of the item count across small assortments but a much smaller slice of revenue. They don't deserve individual forecasting attention. Pool them by category, set a simple reorder threshold, and move on.
One thing worth noting: segmentation isn't a cleanup task you do once. Product moves between segments over its life. A fashion piece that keeps selling becomes a core carry. A core item that fades becomes long-tail. Your segments need to be re-checked periodically, which is exactly why the monthly cadence matters.
The demand-signal cleanup nobody does
Before any forecast is worth anything, you have to fix the number you're forecasting from. Raw sales history lies to you in two directions.
Stockout censoring. When a SKU or size sold out mid-period, your recorded sales understate real demand. A jacket that hit zero on day 12 of a 30-day month didn't "sell 9 units" — it sold 9 in 12 days and then sold nothing because there was nothing left to sell. If you reorder off the 9, you'll keep starving it.
A rough correction that works in practice: if a SKU was in stock only part of the period, scale the in-stock velocity to the full period. Sold 9 in 12 in-stock days → roughly 0.75/day → about 22 for a full month. Reorder off the 22, not the 9. It's not precise, but it's directionally right — and directionally right beats confidently wrong every time.
Size-curve distortion. A SKU can look healthy in total while being broken by size. If you sold 30 units but the M and L sold out weeks ago, your "demand" is really just the leftover XS and XXL trickling through. Forecasting the total tells you to reorder — but reordering the same size curve just refills the sizes that don't move. Demand has to be read at the size level for anything you carry in a real size run.
The mistake worth avoiding: cleaning up the data once, then slipping back to raw numbers next quarter because the cleanup felt tedious. Build the correction into the template so it runs automatically every time you pull the report.
Safety stock without the PhD formulas
Textbook safety-stock math assumes normal demand distributions and stable lead times. Apparel has neither. The goal isn't statistical precision — it's a simple rule set that keeps your important SKUs in stock without bloating your slow movers.
Tie safety stock to two things you actually know: how fast the SKU sells, and how unreliable the supplier is. That second variable matters more than most owners realize. If a vendor's lead time swings between 3 and 8 weeks, no amount of clever forecasting saves you — the variability itself is the risk. Building lead-time reality into your reorder points deserves real attention when you're setting these buffers.
-
Core SKUs safety stock = enough to cover average lead time plus a buffer for lead-time variability. If it normally sells 10/week and lead time ranges 2–4 weeks, cover the 4-week worst case on your top sellers.
-
Seasonal SKUs heavy safety stock early in the curve, near-zero late. A small residual to clear at season end beats a stockout during peak weeks.
-
Fashion SKUs essentially no safety stock. You bought a run, you sell the run. Reordering trend product usually arrives after the trend has already cooled.
-
Long-tail SKUs reorder to a fixed max (something like "keep 2 on hand") rather than computing a buffer. Simplicity is the whole point here.
Prioritize lead-time buffers for core SKUs when vendor variability is the primary risk to availability.
The thing that trips people up: more safety stock always feels safer, so understaffed stores default to over-buffering everything. That's how you end up with cash frozen in slow movers and still stocking out on the fast ones, because the buffer money went to the wrong SKUs. Safety stock is a budget you allocate across your assortment, not a comfort blanket you apply equally to everything.
A monthly review cadence you'll actually keep
A forecasting system that needs weekly attention won't survive a busy season. The whole point of building rules and segments is that most of the work gets pushed into a once-a-month review that takes an hour or two, not a daily fire drill.
A monthly process that holds up in practice:
-
Pull the report. Sales, on-hand, and on-order by SKU and size, with the stockout-corrected demand column already calculated.
-
Re-segment movers. Flag SKUs that crossed a threshold — a fashion piece still selling after 8 weeks, a core item that dropped below its floor velocity. Move them to the right segment.
-
Review core stock positions. Any core SKU below its safety line goes on the reorder list. Any core SKU with more than roughly 10 weeks of cover gets flagged for review.
-
Check seasonal curves against calendar. Are seasonal SKUs tracking their expected curve? If a category is running 20%+ behind the prior-season shape, decide now — markdown early or hold — rather than discovering it in week ten.
-
Sweep the long tail. Batch-review by category. Anything at zero-velocity for 90+ days is a clearance candidate. Anything at its max on-hand needs no action.
-
Set the buy list. Everything above rolls into one reorder decision, not thirty separate panics throughout the month.
Stores that run a disciplined monthly review consistently make fewer, better buying decisions than stores reacting daily. Reactive buying feels productive but usually produces worse outcomes — you're always responding to the last surprise instead of the whole picture.
Visualize the monthly review as a simple workflow.
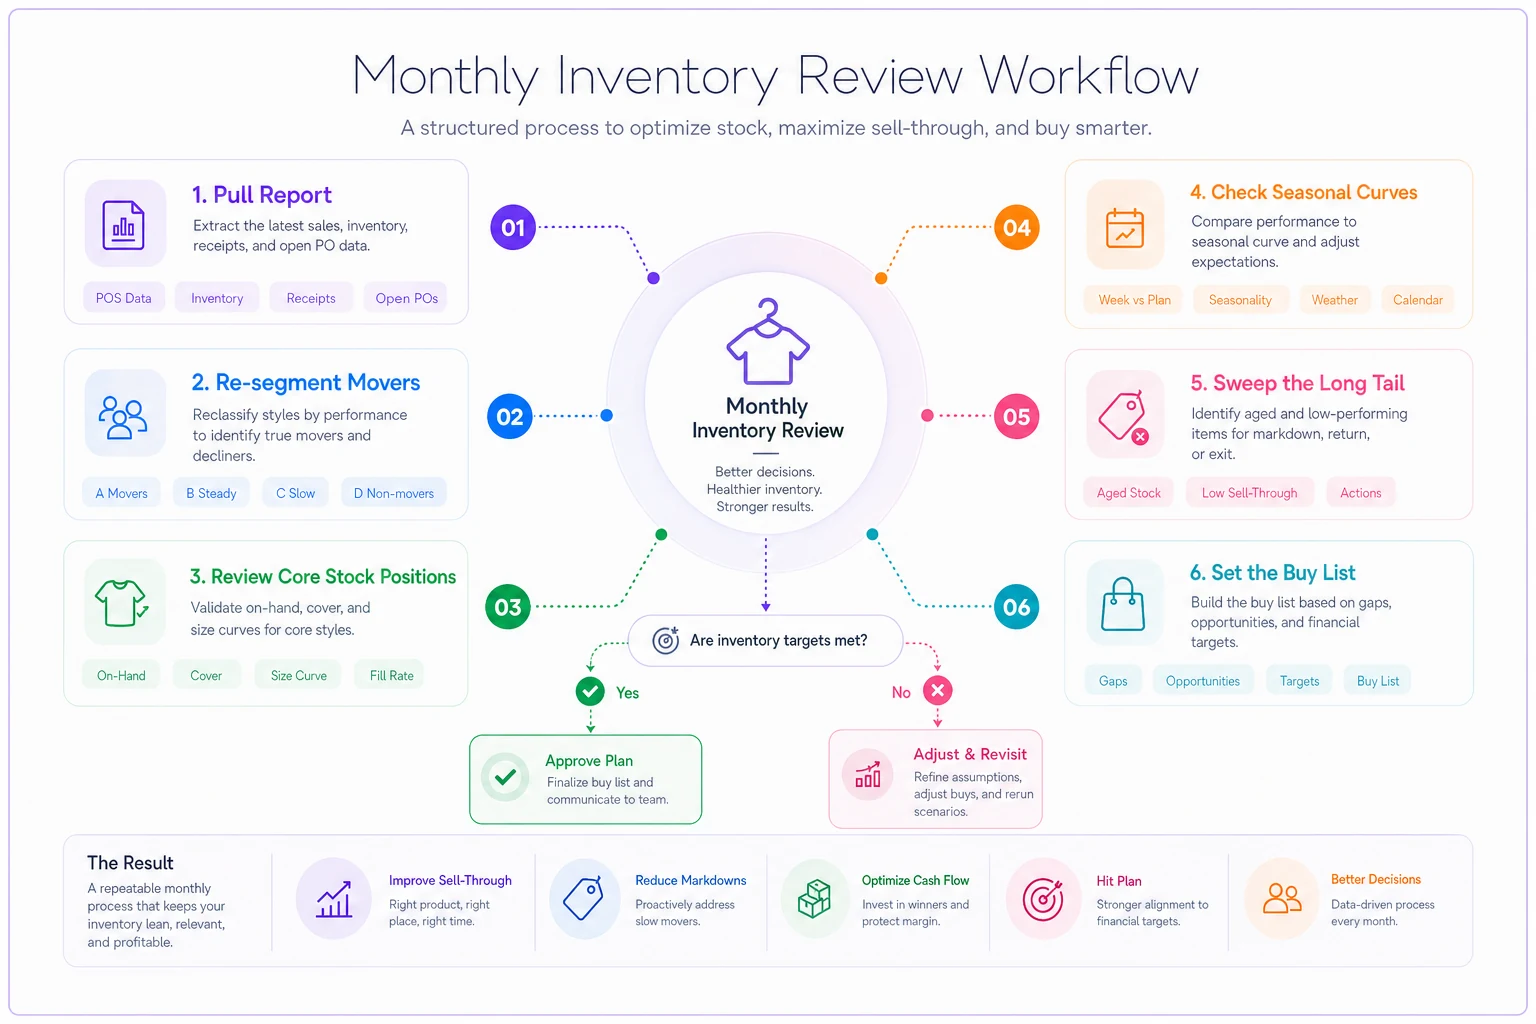
Reactive buying feels productive but usually produces worse outcomes — you're always responding to the last surprise instead of the whole picture.
A real scenario
A women's boutique carrying roughly 900 active SKUs was running the classic swing. Peak-season weekends they'd sell out of best-selling dress sizes by Saturday afternoon, while a back stockroom held 4–5 months of cover on cardigans and scarves that trickled out a few units a month.
The owner wasn't lazy — she was reordering constantly. The problem was that every SKU got the same eyeball treatment, so fast movers and dead weight competed for the same open-to-buy dollars. The best sellers lost that competition more often than they should have.
After segmenting, the changes were unglamorous but effective. Core dresses and denim got real safety stock tied to each supplier's actual (and often unreliable) lead times. The long-tail accessories dropped to a "keep 2, reorder on threshold" rule, which freed up a meaningful chunk of cash that had been sitting in slow stock. Fashion pieces stopped getting reordered on instinct.
Over the following season, peak-weekend stockouts on core sizes dropped noticeably, and the accessory pile stopped growing. Sell-through on the core segment climbed into the high-70s to low-80s percent range, and the open-to-buy that used to disappear into slow movers went toward the product that actually turned. No new software, no complicated math — just different rules for different SKUs and a monthly hour to keep it honest.
When this makes sense — and when it doesn't
This system fits you if you're carrying more than a few hundred SKUs, you have at least one full season of sales history, and you're feeling the stockout/overstock swing. The segmentation approach pays off exactly when your assortment is too varied for a single rule to handle.
This is overkill if you're running a tiny curated shop with 100–150 SKUs where you already know every item personally. At that scale, your instincts are the forecasting engine, and formalizing it adds friction without adding accuracy.
Who should hold off: stores whose underlying SKU data is a mess. If your sizes, vendors, and SKU records aren't clean and consistent, no forecasting layer on top will help — you'll just be forecasting off garbage. Fix the data foundation first, then build the forecast. Same goes if your receiving process is inconsistent enough that on-hand numbers can't be trusted. The forecast is only as good as your inventory accuracy.
Where the manual version starts to strain
The spreadsheet framework works well, and honestly it holds up for a long time. But there's a point where the monthly review stops being an hour and starts eating a weekend. Usually it's the stockout correction and size-level demand cleanup that gets heavy — those steps turn tedious as SKU count climbs past a couple thousand and you're carrying full size runs across multiple locations.
That's the natural point where operational software earns its place. The value isn't magic prediction — it's automating the parts that are both boring and error-prone: pulling clean demand signals with stockout correction already applied, flagging SKUs that crossed a segment threshold, and surfacing the reorder list instead of making you build it manually. AI-assisted forecasting tools are useful here not because they out-guess you on trends, but because they keep the data hygiene and pattern-flagging running quietly in the background. Your monthly review becomes a set of decisions rather than a data-wrangling session. The judgment stays yours; the grunt work doesn't have to.
Whether you run it in a spreadsheet or a platform, the underlying logic is identical. Software just removes the friction that eventually causes people to abandon the discipline — and an abandoned system forecasts nothing.
The template pack
The downloadable templates are built to match everything above, tuned for apparel rather than generic retail:
-
- Segmentation sheet — classifies SKUs into core / seasonal / fashion / long-tail with editable thresholds
-
- Demand-cleanup tab — stockout correction and size-level demand columns built in
-
- Safety-stock calculator — buffers by segment, with a lead-time variability input
-
- Monthly review worksheet — the six-step cadence as a fill-in checklist
-
- Reorder consolidation sheet — rolls flags into a single buy list
Start with the segmentation sheet even if you never touch the rest. Getting your SKUs into the right behavioral buckets fixes more forecasting errors than any formula will.
The reason stockouts and overstocks coexist in the same store isn't bad luck or bad buying — it's a single forecasting rule stretched across products that behave nothing alike. Segment your inventory by how it actually moves, clean the demand signal before you trust it, size safety stock to velocity and supplier reliability, and keep the whole thing honest with a monthly review you can realistically sustain. Do that, and forecasting stops being a guessing game and starts being a set of decisions you can actually defend — which is really all a good system is supposed to give you.
Ready to elevate your apparel business?
Join 2,000+ retailers using Werzly to streamline operations, increase sales, and deepen customer loyalty.