

Most clothing stores drown in data while missing the signals that actually matter. Your POS spits out 47 different reports, Google Analytics shows another 200 metrics, and somewhere in that mess, you're supposed to figure out why your summer inventory is still sitting there in October.
Store owners obsess over foot traffic while their inventory turns once every six months. They celebrate hitting revenue targets while their cash sits trapped in dead stock. They track everything and act on nothing.
The problem isn't lack of data—it's knowing which numbers trigger which decisions. You need maybe eight core metrics that tell you exactly what to do next, not another dashboard that makes you feel productive while your margins erode.
The three KPIs that actually drive apparel profitability
After working with clothing retailers from single boutiques to 12-location chains, the same pattern emerges: stores that thrive focus on three interconnected metrics that form a decision engine. Everything else is noise.
GMROI (Gross Margin Return on Investment) tells you how hard your inventory dollars work. A GMROI of 2.8 means every dollar invested in inventory generates $2.80 in gross margin over the year. Sounds simple until you realize most stores have no idea what theirs is.
Sell-through rate by time band shows velocity—not just what sold, but how fast. A 60% sell-through at 4 weeks means something completely different than 60% at 12 weeks. One signals a winner to reorder, the other warns of incoming markdown hell.
Conversion per floor hour connects staffing to sales. Not conversion rate alone (that's vanity), but conversions per staff hour on the floor. Two stores with 3% conversion rates perform completely differently when one runs 80 floor hours weekly and the other runs 120.
These aren't random metrics. They're diagnostic tools that reveal exactly where your operation breaks down.
Why traditional retail KPIs lead you astray
Walk into any struggling apparel store and ask about their KPIs. They'll show you monthly sales graphs, year-over-year comparisons, average transaction values. All backwards-looking scorecards that tell you what happened, not what to do about it.
Take control of your clothing store operations.
Werzly helps you manage stock, process orders, and engage customers effortlessly.
- Unified inventory and order management
- Automated customer notifications
- Sales and stock analytics
No credit card required
Take traffic counters—boutique owners love these things. "We had 400 people walk through yesterday!" Great. What percentage tried something on? What percentage of those bought? Which staff members were working? Which displays did they interact with? Without context, traffic is just a number to make you feel better on slow days.
Same story with sales per square foot. Your 1,200 square foot boutique doing $400K annually hits $333 per square foot. Industry average for specialty apparel hovers around $325. You're winning, right? Wrong—not if that $400K comes from constantly marking down slow-movers while your winners sell out in days and sit unreordered for weeks.
The metrics everyone tracks—revenue, traffic, average sale—create a false sense of control. You get beautiful reports showing growth trends while your actual profit mechanisms deteriorate. A store doing $60K monthly with 15% net margins beats one doing $80K with 5% margins, but traditional dashboards won't surface that distinction.
Even inventory turnover, supposedly the holy grail of retail metrics, misleads without context. Four turns annually sounds healthy until you decompose it: bestsellers turning 12 times, dogs turning 0.5 times, averaging out to a meaningless four. The average hides the operational disaster underneath.
GMROI: Your inventory profitability decoder
GMROI cuts through the complexity to answer one question: which inventory investments actually pay off? Calculate it by dividing gross margin dollars by average inventory cost. Simple math, profound insights.
A dress style with 55% initial markup that sells through at 85% in six weeks might generate a GMROI of 4.2. Another style with 65% markup that crawls to 40% sell-through over four months, then needs 30% markdowns to clear, might barely hit 1.5. The higher-markup item looked better on paper but destroyed value in practice.
-
GMROI above 3.0
Reorder aggressively, protect from markdowns
-
GMROI 2.0-3.0
Maintain current levels, watch velocity
-
GMROI 1.5-2.0
Stop reordering, plan exit strategy
-
GMROI below 1.5
Mark down immediately, never buy this vendor/style again
GMROI works at any level. By vendor, by category, by price point, by location if you run multiple stores. One boutique discovered their "premium" denim line averaged 1.8 GMROI while their "value" accessories hit 4.5. They'd been prioritizing floor space completely backwards based on gross sales alone.
The trick is calculating GMROI on a rolling basis, not waiting for year-end. Weekly GMROI snapshots for new arrivals tell you within 30 days whether you've got a winner or a dog. No more waiting until season-end to realize half your open-to-buy got wasted on beautiful mistakes.
Sell-through bands: Velocity intelligence that triggers action
Raw sell-through percentage tells you nothing without time context. Selling 50% of a style could be fantastic (if it's been two weeks) or catastrophic (if it's been two months). That's why sell-through bands—percentage sold within specific time windows—drive better decisions.
Week 1-2 Band (Launch Velocity)
-
Above 25%
Reorder immediately if possible
-
15-25%
Strong start, monitor week 3-4
-
10-15%
Adjust merchandising, move location
-
Below 10%
Houston, we have a problem
Week 3-4 Band (Momentum Check)
-
Above 50%
Winner, protect from transfers
-
35-50%
Solid performer, maintain exposure
-
25-35%
Needs intervention (styling, placement)
-
Below 25%
Prepare for first markdown
Week 5-8 Band (Profitability Window)
-
Above 70%
Consider similar styles
-
55-70%
Let it run course at full price
-
40-55%
Light markdown (15-20%) to accelerate
-
Below 40%
Deep cut needed (30%+)
Week 9-12 Band (Exit Strategy)
-
Above 85%
Clean winner, analyze why
-
70-85%
Acceptable outcome
-
Below 70%
Add to clearance rotation
-
Below 50%
Dramatic action required
These bands create automatic triggers. No more agonizing over when to markdown—the bands tell you. A buyer at a three-store chain implemented these exact thresholds and reduced their clearance inventory by 40% within two seasons. Not through genius buying, just faster recognition of problems and clearer action triggers.
The bands also vary by category. Basics might run slower but steadier—adjust your bands down 10-15%. Trend items need faster bands, maybe 30% by week 2.
Conversion per floor hour: The metric that optimizes your biggest expense
Payroll runs 15-25% of sales for most apparel stores, yet owners manage it with stone-age metrics. They schedule based on "busy times" or match last year's hours, wondering why some shifts feel understaffed at 2 sales while others feel overstaffed at 10.
Conversion per floor hour changes the game. Take total conversions (not rate—actual number of sales) and divide by selling hours. Not total payroll hours—actual floor hours where staff engage customers.
A Saturday with 35 conversions and 24 floor hours (3 staff x 8 hours) yields 1.46 conversions per floor hour. A Tuesday with 18 conversions and 16 floor hours hits 1.13. The Saturday feels busier but Tuesday actually underperformed relative to staffing investment.
-
Above 2.0 conversions/hour
Add hours next week
-
1.5-2.0
Maintain current level
-
1.0-1.5
Reduce by one shift
-
Below 1.0
Restructure entirely
The operational magic comes from tracking this by individual employee too. Sarah might average 1.8 conversions per floor hour while Michael sits at 1.1. Same hourly rate, vastly different ROI. You're not tracking sales (that rewards whoever happens to work busy times)—you're tracking conversion efficiency.
One boutique owner started posting weekly conversion/hour rankings in the break room. No punishment for low performers, just visibility. Average store-wide conversion per hour jumped from 1.3 to 1.7 within six weeks. Same traffic, same inventory, just better floor execution from awareness alone.
This metric also reveals scheduling inefficiencies. If Monday 2-5pm consistently shows 0.7 conversions per floor hour, why have two people there? Drop to one, reallocate those hours to Thursday evening when you're hitting 2.1 and probably losing sales to understaffing.
Decision thresholds that eliminate guesswork
Metrics without thresholds are just entertainment. Every KPI needs clear action triggers, removing emotion and guesswork from daily operations.
| Metric | Red Flag | Yellow Flag | Green Light | Exceptional |
|---|---|---|---|---|
| Overall GMROI | Below 2.0 | 2.0-2.5 | 2.5-3.5 | Above 3.5 |
| New Arrival 2-Week Sell-Through | Below 10% | 10-15% | 15-25% | Above 25% |
| 4-Week Sell-Through | Below 25% | 25-35% | 35-50% | Above 50% |
| Conversion/Floor Hour | Below 1.0 | 1.0-1.3 | 1.3-1.8 | Above 1.8 |
| Inventory Age (% over 12 weeks) | Above 30% | 20-30% | 10-20% | Below 10% |
| Markdown % of Sales | Above 35% | 25-35% | 15-25% | Below 15% |
| Vendor GMROI | Below 1.5 | 1.5-2.0 | 2.0-3.0 | Above 3.0 |
| Category Velocity (turns/year) | Below 3 | 3-4 | 4-6 | Above 6 |
Red flags trigger immediate intervention. Yellow flags go on next week's review list. Green light means maintain course. Exceptional triggers deeper analysis—what can we replicate?
These aren't arbitrary numbers. They're based on patterns across dozens of small apparel retailers. Adjust 10-15% based on your market, but the framework holds.
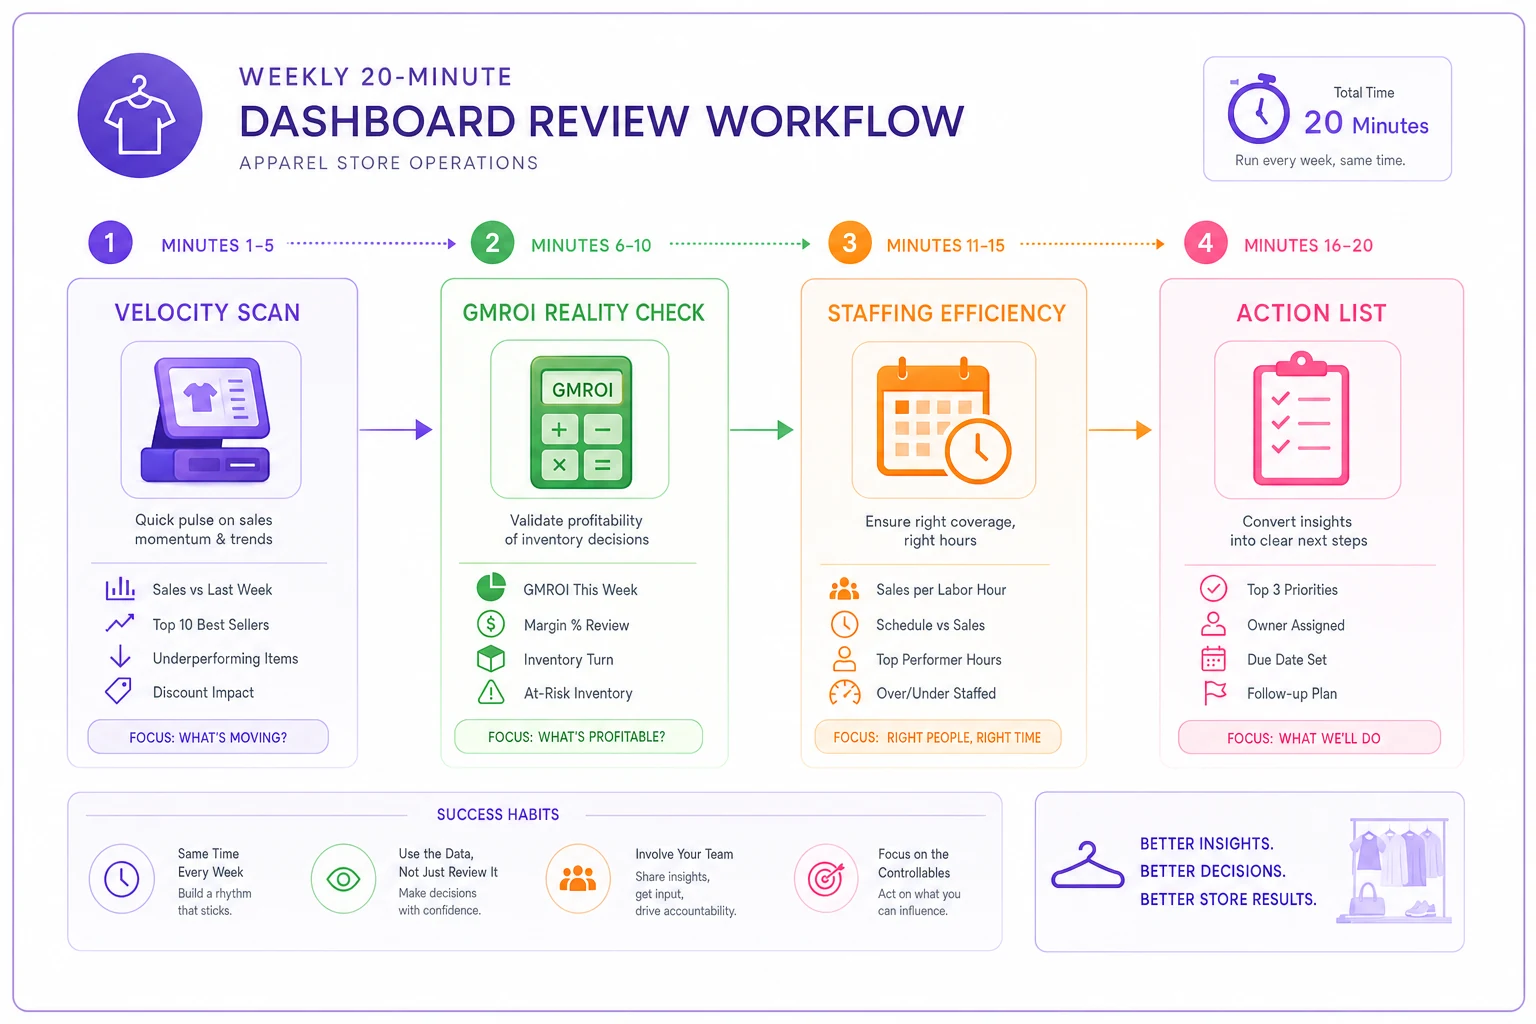
The weekly 20-minute dashboard review that actually drives decisions
Forget elaborate monthly reports nobody reads. You need a Monday morning routine that takes 20 minutes and generates a clear action list.
Minutes 1-5: Velocity Scan
Pull your sell-through bands report. Sort by arrival date. Anything in red flag territory gets flagged for markdown. Anything exceptional gets flagged for reorder consideration. Takes literally five minutes once your POS is set up correctly.
Minutes 6-10: GMROI Reality Check
Look at last week's sales by category, calculate quick GMROI. Just bestsellers first—are your winners really winning? One owner discovered their "bestselling" graphic tees generated 1.9 GMROI while slow-moving scarves hit 3.8. The scarves sold less but generated more margin per dollar invested.
Minutes 11-15: Staffing Efficiency
Calculate last week's conversion per floor hour by day. Flag any shifts below 1.0 for reduction. Flag any above 2.0 for addition. Make scheduling adjustments immediately, don't wait for next week's schedule.
Minutes 16-20: Action List Creation
Based on flags raised, create specific actions. No analysis paralysis, no committee meetings. Just data, thresholds, and actions:
-
Mark down these 8 styles by 25%
-
Reorder these 3 winners
-
Move these slow-movers to front table
-
Cut Tuesday evening to one person
-
Add Saturday morning person
-
Call vendor X about canceling remaining order
Takes literally five minutes once your POS is set up correctly.
Visual guide to the weekly routine:
Based on flags raised, create specific actions. No analysis paralysis, no committee meetings. Just data, thresholds, and actions:
When multi-location complexity multiplies the chaos
Running multiple locations turns KPI management from challenging to mind-bending. That dress flying off racks at your downtown store might be dying at your suburban location. Your best salesperson at Store A would be average at Store B.
Smart operators centralize some metrics while localizing others. GMROI calculations should aggregate—you care about total inventory investment return. But sell-through bands need location-specific tracking. A style might hit 40% sell-through in two weeks downtown but only 15% suburban. Transfer inventory rather than markdown, but only if you track location-level velocity.
Conversion per floor hour absolutely must be location-specific. Your mall store might thrive at 1.3 conversions per hour (high traffic, lower conversion) while your destination boutique needs 2.0+ to justify staffing. Different real estate costs, different traffic patterns, different thresholds.
The biggest mistake multi-location retailers make? Averaging everything. Average sell-through across locations hides transfer opportunities. Average GMROI obscures which locations actually generate profit. Average conversion rates mask staffing inefficiencies.
-
Corporate level
Total GMROI, vendor performance, category mix
-
Location level
Sell-through bands, conversion/hour, markdown rates
-
Style level
Velocity by location, transfer opportunities, reorder triggers
One 5-store chain implemented location-specific dashboards with automated Monday morning alerts. If Style X showed 50%+ sell-through at any location while sitting below 20% at another, automatic transfer alert. Reduced markdowns by $200K annually just from better inventory distribution. Same inventory, same stores, just smarter movement based on location-specific velocity data.
The operational complexity grows, but so do the optimization opportunities.
Building your operational control center without the enterprise price tag
You don't need a $50K enterprise system to implement this framework. Most modern cloud-based POS systems can generate these metrics with some configuration. The challenge isn't technology—it's discipline and process.
Start with manual tracking if necessary. Create a simple spreadsheet:
-
Column A
Style number
-
Column B
Received date
-
Column C
Units received
-
Column D
Week 2 units sold
-
Column E
Week 4 units sold
-
Column F
Current stock
-
Column G
GMROI calculation
Takes 30 minutes weekly to update. Not fancy, but infinitely better than flying blind.
As you scale, automation becomes worthwhile. Modern operational platforms designed for small retailers can track these KPIs automatically, send alerts when thresholds are crossed, and even suggest actions based on patterns. The AI components help identify non-obvious patterns—like certain styles performing better on specific days or with specific staff members.
Start with the simple spreadsheet to build the weekly habit before investing in automation.
Whether you're using paper, spreadsheets, or AI-powered platforms, the framework remains the same. Measure what matters, set clear thresholds, trigger specific actions. Everything else is just expensive decoration.
The compound effect of disciplined KPI management
Implement this framework religiously for 90 days and your inventory starts moving faster. Not because you bought better (that takes longer), but because you're identifying and fixing problems weekly instead of seasonally. Your staffing costs drop while conversion improves. You're scheduling based on actual productivity, not gut feel. Your markdown rate decreases. You're catching dogs at week 3, not week 12.
Month six is where things get interesting. Your buying improves because you have clear data on what actually generates returns. Your cash flow improves because less capital sits in dead inventory. Your team performs better because they understand exactly what drives success.
A boutique in Denver implemented this exact framework. Year one: 18% reduction in markdowns, 22% improvement in inventory turns. Year two: 31% increase in GMROI, opened a second location with confidence because they knew exactly which inventory and staffing models worked.
They didn't become better merchants overnight. They just started measuring the right things and acting on them consistently.
Results compound over time, but the foundation is simple: track what matters, ignore what doesn't.
Stop drowning in data, start driving decisions
Most apparel retailers are data rich and insight poor. They track everything and act on nothing. They generate reports that make them feel professional while their core operations slowly deteriorate.
This framework flips that dynamic. Eight core metrics, clear thresholds, specific actions. No interpretation required, no meetings needed, just systematic improvement based on what actually drives profitability in apparel retail.
The stores that thrive don't have better products or better locations or better customers. They have better operational discipline. They know their GMROI by vendor, their sell-through by week, their conversion by hour. More importantly, they know exactly what to do when those numbers drift outside acceptable ranges.
Your POS already collects most of this data. Your inventory system has the rest. The question isn't whether you can implement this framework—it's whether you're willing to stop chasing van
Your POS already collects most of this data. Your inventory system has the rest. The question isn't whether you can implement this framework—it's whether you're willing to stop chasing van
Ready to elevate your apparel business?
Join 2,000+ retailers using Werzly to streamline operations, increase sales, and deepen customer loyalty.