


Returns are killing small apparel stores right now. Not because customers are pickier—they've always been picky. The real problem is that most stores track returns wrong, or barely track them at all.
You get a pile of returned items at the end of each month. Maybe you know your overall return rate hovers around 25-30%. But that number tells you nothing about why those jeans keep coming back, or why a specific dress style has a 40% return rate while similar ones sit at 15%.
The difference between stores that control returns and those that don't comes down to capturing the right data and actually looking at patterns. Not complex algorithms or expensive software—just tracking specific fields consistently and checking them against each other once a week.
The returns problem nobody talks about
Most stores treat returns like weather—something that just happens. They process the return, put the item back on the floor, and move on. Maybe they ask why the customer returned it. Usually nobody writes it down.
Stores that get returns under control tend to do something pretty simple: they track five specific data points on every return, spend 20 minutes each Monday reviewing patterns, and test small changes based on what they find. That's genuinely it.
A boutique owner in Dallas showed me her returns tracking setup. Nothing fancy—just a Google Sheet with columns for SKU, return reason, purchase channel, customer segment, and fitting room notes. After three months of consistent tracking, she spotted that size Medium blazers from one specific vendor had a 38% return rate, all flagged for "runs small." She added a sizing note to the product page and had staff mention it during fitting room interactions. Return rate on those blazers dropped to 14% within six weeks.
That's roughly $8,400 in prevented returns annually from fixing one sizing communication issue across twelve SKUs. Found through a basic spreadsheet and 20 minutes of pattern checking per week.
Why standard return tracking fails small stores
The typical process: customer returns something, staff processes it in the POS, maybe selects "doesn't fit" from a dropdown, transaction done. All that data sits in your POS system going nowhere because it's not structured to surface patterns.
Take control of your clothing store operations.
Werzly helps you manage stock, process orders, and engage customers effortlessly.
- Unified inventory and order management
- Automated customer notifications
- Sales and stock analytics
No credit card required
Even stores that try to track returns properly often capture the wrong information. They'll track return value by day, maybe by category. But knowing "tops" had $1,200 in returns last month doesn't tell you if it's a sizing problem, a quality issue, or misleading product photos.
The real insight comes from crossing return reasons with specific SKUs, then checking those against where and how customers bought. Online buyers returning that black dress because it photographs matte but has a slight sheen in person—in-store buyers who tried it on first don't have that problem. You only catch this by segmenting returns properly.
Setting up returns analytics for small apparel stores
Forget complicated analytics software. You need five core fields tracked consistently:
SKU/Style Code - Not just "black dress" but the actual product identifier
Actual Return Reason - The real reason, not what the customer initially says
Purchase Channel - In-store, online, Instagram, pop-up
Customer Type - New, repeat, VIP, wholesale
Context Notes - Fitting room feedback, staff observations, anything relevant
The challenge isn't the setup—it's getting honest return reasons. Customers say "doesn't fit" when they mean "looks cheap in person" or "husband didn't like it." Train staff to dig one level deeper with a simple follow-up: "Was it the overall fit or something specific about the sizing?"
Use dropdowns for common return reasons to speed entry and keep data consistent.
Build this as a basic spreadsheet:
| Date | SKU | Item Description | Return Reason | Purchase Channel | Customer Type | Original Sale Date | Days to Return | Notes |
|---|---|---|---|---|---|---|---|---|
| 11/4 | BLZ-M-042 | Navy Blazer M | Runs small | Online | New | 10/28 | 7 | Customer usually wears S, sized up but still tight |
| 11/4 | DNS-S-019 | Floral Dress S | Color different | Repeat | 10/15 | 20 | Looked coral in post, actually pink |
This simple structure surfaces patterns that standard POS reports miss entirely.
Finding real patterns in your returns data
SKU + Return Reason: Shows product-specific problems. When five different customers return the same sweater for "pills after one wear," you have a quality issue with that specific item, not sweaters in general.
Channel + Return Reason: Online shoppers returning for color differences points to photography. In-store shoppers returning for quality issues suggests staff aren't closely checking garments during sales interactions.
Customer Segment + SKU: When new customers return certain styles at three times the rate of repeat customers, those items probably don't match your brand's typical quality or fit. Repeat customers know what to expect. New ones don't.
Weekly pattern checks take about 20 minutes. Sort by SKU, scan for items with three or more returns, check if reasons cluster. Filter by purchase channel and see if problems concentrate online or in-store. Then look at return timing—items returned within three days usually have obvious problems; returns after two or three weeks often point to quality issues that only appear with wear.
Cross-checking with fitting room and product page data
Returns data alone tells you what went wrong. Cross-checking with other touchpoints tells you where to fix it.
Pull fitting room notes for your highest-return items. Staff might have written "customer loved style but between sizes" several times for the same dress. That's not a prevented return—it's a future return in progress when those customers order both sizes online to try at home.
Match this against your product pages. That dress with sizing issues—does the size chart actually reflect the garment measurements? A store in Austin discovered their vendor had gradually changed the cut on a best-selling jean style over six months. The size chart stayed the same. Returns crept from 8% to 27% before anyone connected the two.
Check your product descriptions too. "Relaxed fit" means different things to different customers. One store started adding reference points: "Relaxed through the body, similar fit to our Casey tank but 2 inches longer." Returns on that item dropped by half because customers could compare it to something they already owned and knew.
Stop chasing vanity metrics: the apparel KPI framework that tells small stores what to act on — because tracking returns without context is just another number that doesn't drive action.
Building your testing roadmap from returns data
Finding problems means nothing if you don't test fixes. Small stores can't overhaul everything at once—you need focused tests that give clear answers.
Start with the highest-volume problem. If one SKU has 15 returns for "runs small," test adding a sizing callout to the product page first. Give it two weeks, track returns on that specific SKU. If returns drop, roll the same approach to similar items.
Testing priorities based on return volume and fix complexity:
Quick fixes (test immediately):
-
Add sizing notes to product pages
-
Update product photos for color accuracy
-
Train staff to mention known fit issues
-
Add measurement videos for tricky items
Medium effort (test within the month):
-
Revise size charts with actual garment measurements
-
Create fit comparison guides between similar styles
-
Add "how to style" content for pieces that get returned for "doesn't match anything"
-
Implement a fit quiz for online shoppers
Larger changes (plan for next quarter):
-
Drop problematic vendors
-
Redesign product pages with better size and fit information
-
Introduce virtual fitting tools
-
Revamp photography standards
Each test needs clear success metrics. "Reduce returns" is too vague. "Reduce size-related returns on blazers by 50% within six weeks" gives you something to actually measure.
The compact tracking template that actually works
Here's the Excel/Google Sheets setup that works for stores doing somewhere between $200k and $2M annually. More complex and people won't maintain it. Simpler and you miss critical patterns.
Main Returns Tab:
-
Return ID (auto-number)
-
Date
-
SKU
-
Product Name
-
Size
-
Color
-
Original Price
-
Return Reason (dropdown)
-
Detailed Reason (free text)
-
Purchase Channel
-
Purchase Date
-
Customer Email
-
New/Repeat Customer
-
Notes
Weekly Analysis Tab (auto-calculated):
-
Return rate by SKU
-
Return rate by reason
-
Return rate by channel
-
Average days to return
-
Repeat returners list
Monthly Patterns Tab:
-
Top 5 problem SKUs
-
Emerging issues (reasons increasing month-over-month)
-
Channel-specific problems
-
Vendor quality scores
This takes maybe two minutes per return to fill out properly. The analysis tabs update automatically if you set up basic formulas. Every Monday morning, spend 20 minutes reviewing the weekly analysis tab and identify one thing to test that week.
When automation makes sense for returns analytics
Manual tracking works fine up to around 20-30 returns weekly. Beyond that, you're spending too much time on data entry instead of fixing the actual problems.
AI-powered operational software can automate the returns analytics workflow—pulling return reasons from POS systems, matching them against product data, identifying patterns across channels, and flagging which fixes to prioritize based on potential impact. What takes a couple of hours manually can surface in minutes, and you get alerts when new problem patterns emerge.
The less obvious benefit is that automated systems catch patterns humans miss. Like returns spiking 15 days after Instagram posts because that's how long shipping and trying-on typically takes. Or specific size and color combinations with higher return rates but only from customers acquired through Facebook ads. These aren't patterns you'd notice combing through a spreadsheet once a week.
The goal isn't replacing human judgment—it's freeing up time to actually implement fixes instead of hunting patterns in spreadsheets. A boutique owner running three locations told me switching to automated returns tracking saved her roughly four hours a week. She used that time to personally call customers who returned high-value items, and learned more about fit issues in one month than she had in the previous year of basic return processing.
Testing what actually moves the needle
Most stores test the wrong fixes first. They redesign all their product pages when two problematic vendors account for 60% of returns. They invest in virtual try-on technology when adding accurate measurements would solve most sizing issues.
Start with the highest-impact, lowest-effort fixes. If 40% of online returns cite sizing but your product pages have no garment measurements, that's your first test. Not a size recommender tool, not virtual fitting—just basic measurements.
A store in Denver tracked returns on their house-brand basics for two months. Every single return on their $38 henley mentioned "thin material," so they added "lightweight 140gsm cotton, perfect for layering" to the description. Returns dropped from 22% to 7%. No photo reshoot, no vendor switch—just an honest product description.
Test one change at a time. If you update photos, add size charts, and retrain staff simultaneously, you won't know what actually moved the needle. Give each test at least two weeks for online changes, one week for in-store changes.
Document everything—what you changed, when you changed it, and what happened to returns afterward. Six months from now when returns creep back up, you'll know exactly what worked before.
Building returns prevention into daily operations
The best tracking setup means nothing if insights don't reach the right people. Your visual merchandiser needs to know the cream sweater photographs poorly online. Floor staff need to know the black jeans run a full size small. The buying team needs vendor quality scores before placing next season's orders.
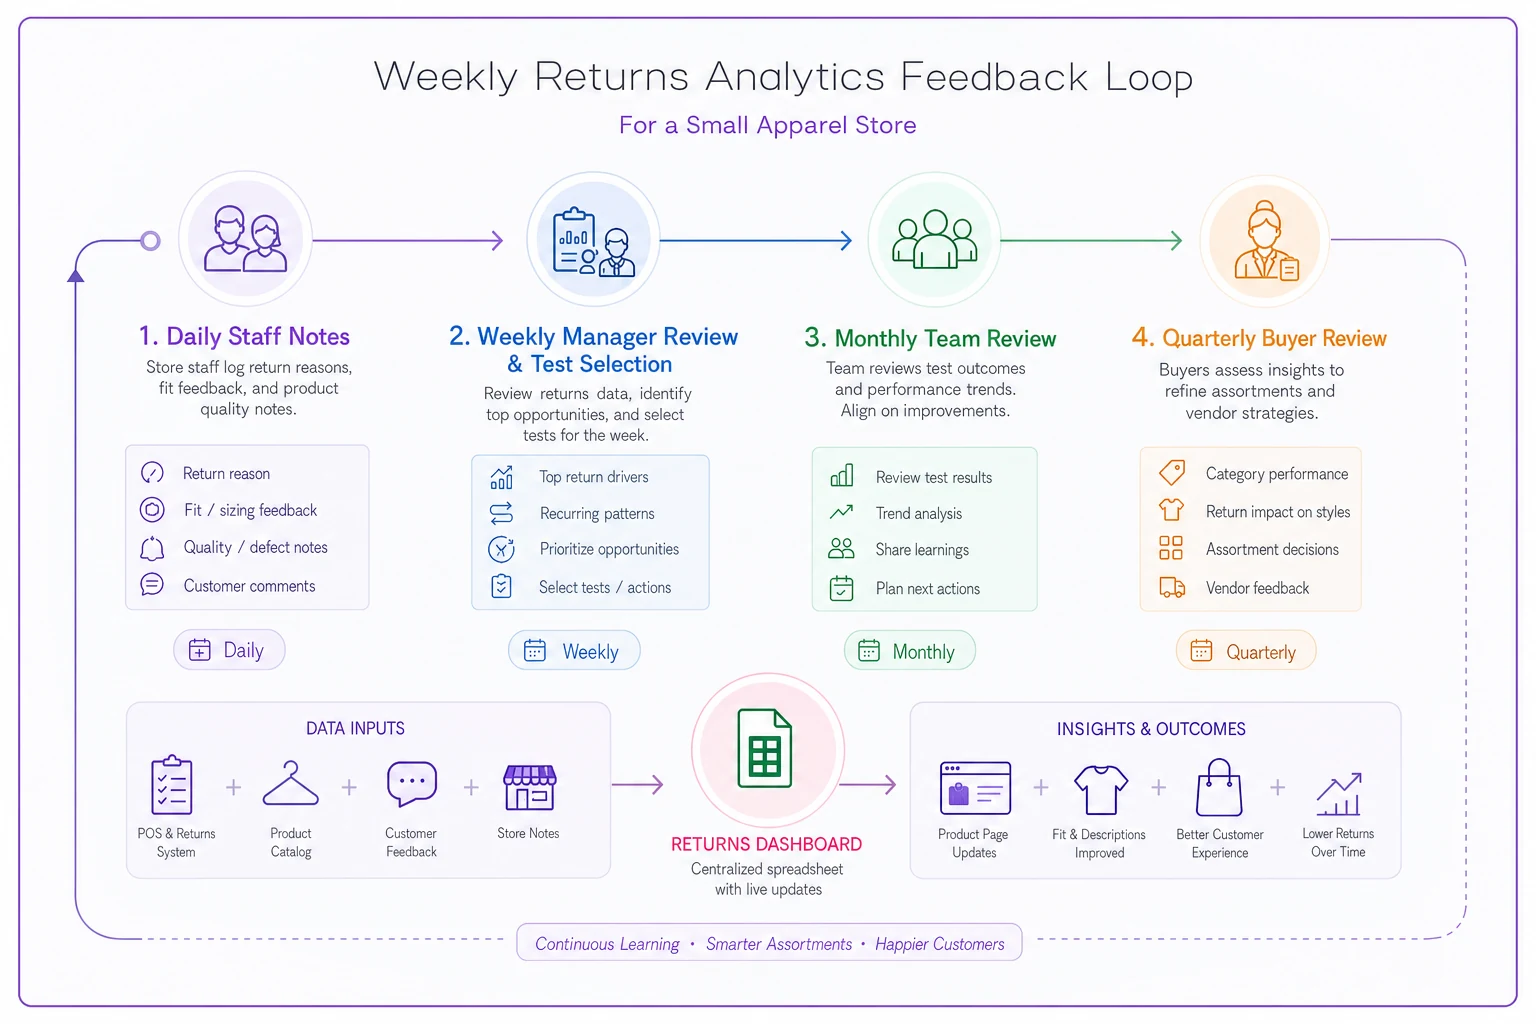
A simple way to structure this is a weekly feedback loop across four time horizons:
-
Daily — Staff adds return notes to the tracking sheet
-
Weekly — Manager reviews patterns, picks one test, communicates to relevant team
-
Monthly — Full team reviews major patterns, monthly shrinkage micro-audit for clothing stores style, to catch any quality issues driving returns
-
Quarterly — Buyer reviews vendor return rates before reordering
Here's a simple visual of the feedback loop workflow.
Small stores often skip the communication step entirely. They track returns, find patterns, but insights die in spreadsheets. One email weekly with "This Week's Return Pattern: Gray Cardigans running large—please mention during fitting room interactions" does more than complex dashboards nobody checks.
Make it part of someone's job to close the loop. Manager assigns the test, merch team updates pages, staff mentions during fitting room interactions, and buyer adjusts future orders if needed.
Know when you're tracking too much
Some stores go overboard. They track 30 fields per return, build elaborate dashboards, spend hours on analysis—and still have the same 25% return rate because they're not actually testing fixes.
Signs you've gone too far:
-
Data entry takes longer than processing the actual return
-
You have insights you haven't acted on in over a month
-
Staff avoids the tracking system because it's too complex
-
You're tracking metrics that don't lead to specific actions
One boutique tracked customer height, weight, usual size in other brands, style preferences, and a dozen other fields for every return. They spent 45 minutes weekly on their "comprehensive returns database" but hadn't implemented a single fix in three months. When they cut it to five core fields and started testing weekly, returns dropped 8% in two months. Simpler system, better results.
Making returns analytics stick
The hardest part isn't setup—it's maintaining consistency when things get busy. Holiday rush hits and suddenly nobody's recording return reasons. New staff starts and doesn't know the system. The owner gets pulled in another direction.
Build it into your routine like cash reconciliation. Returns don't get processed without data capture. Make it faster to record the information than to skip it. Use dropdowns for common reasons. Keep the tracking sheet open on the POS computer. Train everyone who might process a return.
And show the wins. When a sizing note reduces returns by 15%, tell everyone. When fixing product photos saves $500 in monthly returns, make a point of it. People maintain systems that clearly work.
A returns analytics setup for small apparel stores doesn't need to be complex. Track five core fields, review patterns weekly, test specific fixes, and communicate insights to your team. Do this consistently for three months and you'll cut preventable returns by at least 20-30%.
Stores struggling with 30-40% return rates aren't victims of picky customers or the rise of online shopping. They just haven't built simple systems to identify and fix the operational issues causing those returns. Start with a basic spreadsheet this week, track every return for 30 days, then fix the biggest problem you find. It really is that straightforward.
Ready to elevate your apparel business?
Join 2,000+ retailers using Werzly to streamline operations, increase sales, and deepen customer loyalty.