


Most small apparel shops don't have an architecture problem when they open. They have one register, one stockroom, and a spreadsheet somebody updates on Sunday nights. That works fine until it doesn't — and when it stops working, it's almost never obvious. It shows up as a customer standing at the counter while you check the back for a size the system swears you have. Or a "bestseller" you reordered heavily that turns out to have been double-counted across two channels.
The reason minimal retail tech architecture for a small store matters isn't because you need more software. It's actually the opposite — you need the fewest systems that still talk to each other cleanly. Every tool you add is another place data can drift. The goal is a small map where each piece has one job and one clean handoff to the next.
This post lays out that map — POS → inventory → analytics → fulfillment — plus the exact fields that need to move between them, five reports worth automating, and a migration checklist for going from one store to three. It's tool-agnostic on purpose. The principles hold whether you run Square, Lightspeed, Shopify POS, or something stitched together with good intentions.
The four-box map (and why order matters)
Think of your stack as four boxes with arrows between them. The arrows are where money leaks.
-
POS — the source of truth for what sold, when, and for how much.
-
Inventory — the source of truth for what you own and where it physically sits.
-
Analytics — a read-only layer that pulls from the first two and tells you what to do.
-
Fulfillment — everything that moves stock out the door
BOPIS, ship-from-store, transfers.
The mistake most people make is buying the analytics dashboard first because it's the fun part. They wire it up to messy POS and inventory data and wonder why the numbers feel off. Analytics should be the last box you trust, because it's only as good as the two boxes feeding it.
The other common failure is treating inventory and POS as one thing because the POS "does inventory too." It does — for one location, at one register, when nobody's doing transfers or receiving off-hours. The second you add a stockroom count, an online channel, or a second store, POS-native inventory starts lying to you in small ways that compound fast.
A useful rule: POS owns transactions, inventory owns quantity-on-hand, and nothing else gets to change quantity-on-hand except inventory. If your e-commerce platform and your POS both think they can decrement stock, you will oversell. That single boundary prevents more headaches than any dashboard ever will.
Exact fields to sync between boxes
This is the part everyone skips and everyone regrets. Syncing "products" isn't a plan — you sync fields. If the fields don't match on both sides, the sync silently fails or creates duplicates.
Take control of your clothing store operations.
Werzly helps you manage stock, process orders, and engage customers effortlessly.
- Unified inventory and order management
- Automated customer notifications
- Sales and stock analytics
No credit card required
Below is the minimum set that has to move cleanly between systems. If you already have a clean SKU structure — and if you don't, fix that first, because a single source of truth for SKUs, sizes and vendors is the foundation everything here sits on — most of this becomes mechanical.
| Field | Owned by | Syncs to | Why it breaks if missing |
|---|---|---|---|
| SKU (variant-level) | Inventory | POS, Analytics, Fulfillment | The join key for everything. Style-level SKUs can't track size sell-through. |
| Style / parent ID | Inventory | Analytics | Lets you roll up size variants into one buying decision. |
| Size + color | Inventory | POS, Fulfillment | Wrong size picked at BOPIS = a return and a refund. |
| Quantity-on-hand (per location) | Inventory | POS, Fulfillment | Without per-location QOH, ship-from-store guesses. |
| Unit cost | Inventory | Analytics | No cost = no real margin. Retail-only reports are vanity. |
| Retail price + markdown price | POS | Analytics | Markdown price must sync or margin math is wrong during sales. |
| Vendor ID | Inventory | Analytics | Reorder and supplier scorecards depend on it. |
| Transaction timestamp | POS | Analytics | Powers sell-through velocity and daypart staffing. |
| Location ID | POS + Inventory | Analytics, Fulfillment | The field that makes multi-store even possible. |
| Order status | Fulfillment | POS, Analytics | Open vs picked vs fulfilled — the state machine BOPIS runs on. |
A few things worth flagging. Unit cost is the field people forget to sync, and it's the one that turns your analytics from decoration into decision-making. A dashboard showing revenue by category is nice; a dashboard showing margin dollars by category tells you what to actually buy again.
Location ID is the field that quietly enables growth. When you're running one store, you can leave it blank and nothing breaks. The problem is that a year later when you open store two, none of your historical data has it, and you can't compare stores or reconcile transfers. Stamp every transaction and every inventory record with a location from day one, even if there's only one location. It costs nothing now and saves a painful migration later.
The five reports actually worth automating
You don't need a BI team. You need five reports that run on their own and land somewhere you'll actually look. Everything beyond these tends to become noise — the KPI trap is real, and it's worth being ruthless about what earns a spot on that list, which is the whole argument behind an apparel KPI framework that tells you what to act on.
1. Weekly sell-through by style and size. Units sold ÷ units received, at the variant level, over a rolling window. This is the report that tells you what to reorder and what's about to become deadstock. The size breakdown matters more than most people realize — a style at 60% overall sell-through might be 95% sold in M/L and completely dead in XS/XXL, which is a re-buy and a markdown decision in the same line.
2. Margin-dollar contribution by category. Not margin percent — margin dollars. A 70% margin on a slow scarf line can contribute less than a 40% margin on denim that actually moves. Sorting categories by dollars contributed reorders your buying attention in ways that margin-percent reporting never does.
3. Stock-position and stale-inventory flag. Anything past a velocity threshold — say, fewer than X units sold in the last 30 days while holding more than Y on hand — gets flagged automatically. The value is surfacing slow movers before they age into full markdown territory, not after.
4. Fulfillment exception report. Open BOPIS orders older than your SLA, ship-from-store orders unpicked past a cutoff, transfers in-transit longer than expected. This is the report that catches the customer complaint before it arrives.
5. Cross-location availability and transfer candidates. Once you have more than one store, this shows where a SKU is sitting dead in one location while selling out in another. It's the difference between marking something down at Store A while Store B was asking for it.
Notice what's not on the list: foot traffic, social followers, conversion rate without margin behind it. Those feel like progress and rarely change a buying decision.
How the workflow actually flows
Walk the path of a single unit and the handoffs get concrete fast.
Vendor Receiving → Inventory (QOH +1, cost + vendor attached) ↓ POS (sale recorded: SKU, price, timestamp, location) ↓ Inventory (QOH -1, online channel updates) ↓ Analytics (overnight join: sell-through + margin update) ↓ Fulfillment (online order → location routed → status: picked → POS + Inventory notified)
Here's a quick visual of that flow.
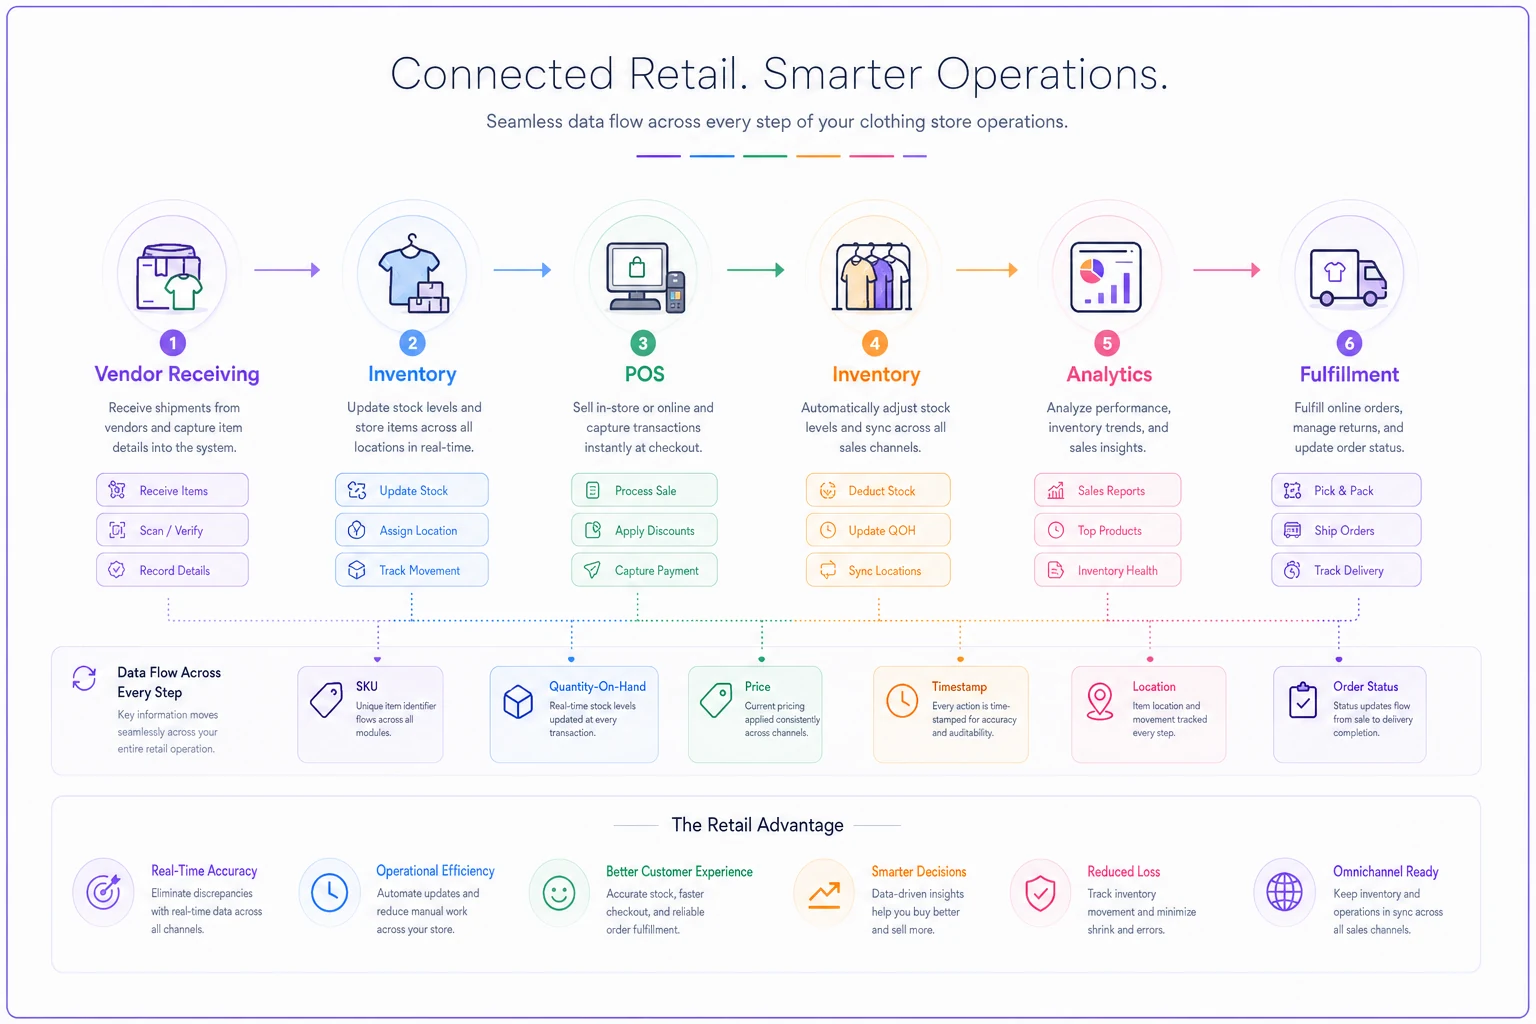
A sweater arrives from a vendor. Receiving updates inventory — quantity-on-hand goes up at that location, unit cost and vendor ID attach to the variant SKU. Nothing touches the POS yet; the POS just needs to read that the item exists and how many there are.
A customer buys it. POS records the transaction: SKU, price, timestamp, location. The POS then tells inventory to decrement one unit at that location — and that's the only signal that reduces quantity. Inventory updates, and because inventory is the single owner of QOH, your online channel now reflects one fewer available.
Analytics reads both streams overnight. It joins the sale to the inventory record on the SKU, and sell-through and margin reports update without anyone touching a spreadsheet.
Meanwhile an online order comes in for the same style at a different size. Fulfillment checks per-location QOH, routes it to whichever store has stock depth, marks the status "picked," and that state flows back so the POS and inventory both know that unit is committed.
The whole thing works because each box has one job and the arrows only go one direction per field. When shops describe their system as "a mess," it's almost always because two boxes both think they own the same field.
Where this gets clunky: automation patterns that hold up
You don't need heavy tooling to automate the repetitive parts, but you do need clear triggers. The patterns that survive contact with a real store:
-
Event-triggered, not time-triggered, where it counts. A fulfillment exception should fire when an order crosses its SLA — not once a day at 9am when the customer is already annoyed.
-
Nightly batch is fine for analytics. Sell-through and margin don't need to be real-time. Real-time analytics is a cost most small stores don't need to pay.
-
One reconciliation job, not five. A single nightly check that flags SKUs where POS-sold and inventory-decremented don't match will catch most drift. Chasing it in real time burns hours for little gain.
-
Alerts should surface exceptions, not summaries. If a report emails you the same 200 rows every day, you'll stop reading it. It should only show what changed or what's broken.
Prioritize event-triggered alerts for fulfillment exceptions and rely on nightly batches for analytics where acceptable.
This is also where lightweight operational platforms earn their keep — not by adding another dashboard, but by sitting between the boxes and handling syncs and exception alerts so a two-person team isn't manually reconciling channels at midnight. The point isn't automation for its own sake. It's removing the specific manual steps that create errors when people are tired or distracted, which in small apparel operations is most of the time.
A real scenario: one store to three
A women's apparel shop running a single location on POS-native inventory decided to open two more stores over about eighteen months. Before the expansion, they had no location field, style-level SKUs with no size granularity, and did their "analytics" in a weekly spreadsheet built from POS exports.
The first new store broke everything quietly. Because SKUs weren't variant-level, they couldn't tell which sizes to send in transfers. Because there was no location stamp on historical data, they couldn't compare the new store's performance to the flagship. Transfers between stores were tracked in a group text.
They spent roughly three weeks on cleanup before store two even opened: rebuilding SKUs at the size level, adding location IDs to every record, and setting inventory — not POS, not the website — as the single owner of quantity. The five reports above got automated and landed in a shared inbox each morning.
The shift wasn't dramatic revenue growth. It was error reduction. Oversells on the online channel dropped to nearly zero. Deadstock flagged by the stale-inventory report got moved between stores instead of marked down, which protected somewhere around $4k–$6k in margin over the first season. The group-text transfer system turned into the cross-location report, so stock moved based on where it would actually sell.
The lesson wasn't "buy better software." It was that the architecture — clean fields, one owner per field, location stamps on everything — is what let three stores run without three times the chaos.
The migration checklist: 1 → 3 stores
Do these in order. Skipping ahead is how people end up with dirty multi-store data they can't fix later.
-
Convert to variant-level SKUs (style + size + color). No multi-store move works on style-level SKUs.
-
Add a Location ID to every record — transactions, inventory, receiving — even the single existing store's history if you can backfill it.
-
Declare one owner of quantity-on-hand. Inventory owns it. Turn off any other system's ability to change stock counts.
-
Verify unit cost and vendor ID exist on every active SKU. Margin reports are useless without them.
-
Set per-location QOH before fulfillment routing. Ship-from-store guesses badly without it.
-
Automate the five reports and route them somewhere shared, not a personal inbox.
-
Define transfer rules and SLA before you're improvising over text.
-
Run one reconciliation job nightly to catch POS-vs-inventory drift.
-
Test the full loop with 10 real SKUs across all three stores before going live everywhere.
Work through each item before moving to the next. It feels slow, but shops that skip ahead almost always end up backtracking anyway — usually at the worst possible time.
When this makes sense — and when it doesn't
When it's worth doing now: you're planning a second location within a year, you're running more than one sales channel, or you've already been burned by an oversell or a phantom-stock situation. The architecture pays for itself the first season you avoid a markdown by transferring stock instead.
When it's overkill: you're a genuine single-location, single-channel shop with no growth plans and stable inventory. If the Sunday-night spreadsheet works and you sleep fine, adding sync layers introduces failure points you don't need yet. Just do the cheap, future-proofing parts — variant SKUs and location IDs — so you're not stuck later.
Who should not do this yet: anyone who hasn't cleaned up their SKU structure. Building sync and reports on messy product data is pouring concrete on a bad foundation. Fix the data model first, then wire the boxes together.
The takeaway
The stores that scale without drama aren't the ones with the most software — they're the ones where every field has exactly one owner and every handoff goes one direction. Get the SKUs clean, stamp location on everything, let inventory own quantity, and automate only the five reports that actually change decisions. Do that, and going from one store to three feels like more of the same system, not a system in crisis. The tools matter far less than the boundaries between them.
Ready to elevate your apparel business?
Join 2,000+ retailers using Werzly to streamline operations, increase sales, and deepen customer loyalty.