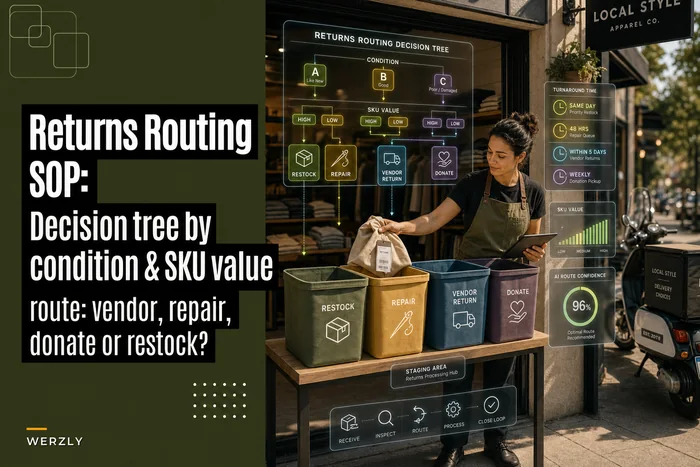



Most small apparel shops treat returns as a line item that just... happens. Money goes out, product comes back, someone restocks it when they get around to it. The return rate shows up in a monthly report, everyone frowns, and nothing really changes because nobody can point to what a return actually costs once you add up the pieces.
That's the gap this post fills. Not "how to reduce returns" — plenty has been written on that, including the root-cause work in a simple returns analytics pack to find root causes and cut return rates. This is the economics layer underneath. When a return comes in, where does it go, what does it cost to get it there, and how much of the original margin do you actually recover?
Once you can answer that per return reason and per disposition channel, policy decisions stop being guesses. You can see which refunds to tier, which items deserve a restocking deposit, and which returns are quietly losing money every single time they walk back through the door.
Why returns math stays invisible until it hurts
The cost is spread across people and time nobody tracks. That's mostly it.
A customer returns a dress. The real cost isn't the refund — that's just reversing a sale. The cost is the labor to inspect it, the time to re-tag and re-hang it, the shipping back if it was an online order, the payment processing fee you often don't get back, and the margin you lose if the item has to sell at markdown because it came back scuffed or out of season.
Across one or two returns a day, none of that feels like much. At 15–25 returns a week across a couple of stores, it becomes real money that never shows up as its own number. It gets buried inside "labor" and "markdowns" and "shipping," so there's nothing to manage.
What tends to be true across a lot of small retailers: the shops who think they have a return problem usually have a return routing problem. The returns themselves are normal for apparel. What's killing them is that every return gets treated the same way — inspected casually, restocked by default — regardless of whether that item can actually be resold at full price.
The core model: reason → cost-to-recover → disposition
The whole thing rests on one idea. Every returned item has:
Take control of your clothing store operations.
Werzly helps you manage stock, process orders, and engage customers effortlessly.
- Unified inventory and order management
- Automated customer notifications
- Sales and stock analytics
No credit card required
-
A return reason (why it came back)
-
A cost-to-recover (what you spend to get it sellable again, or dispose of it)
-
A disposition channel (where it ends up)
Get those three mapped and your P&L stops lying to you.
The diagram below shows the routing flow from return reason to cost-to-recover to disposition.
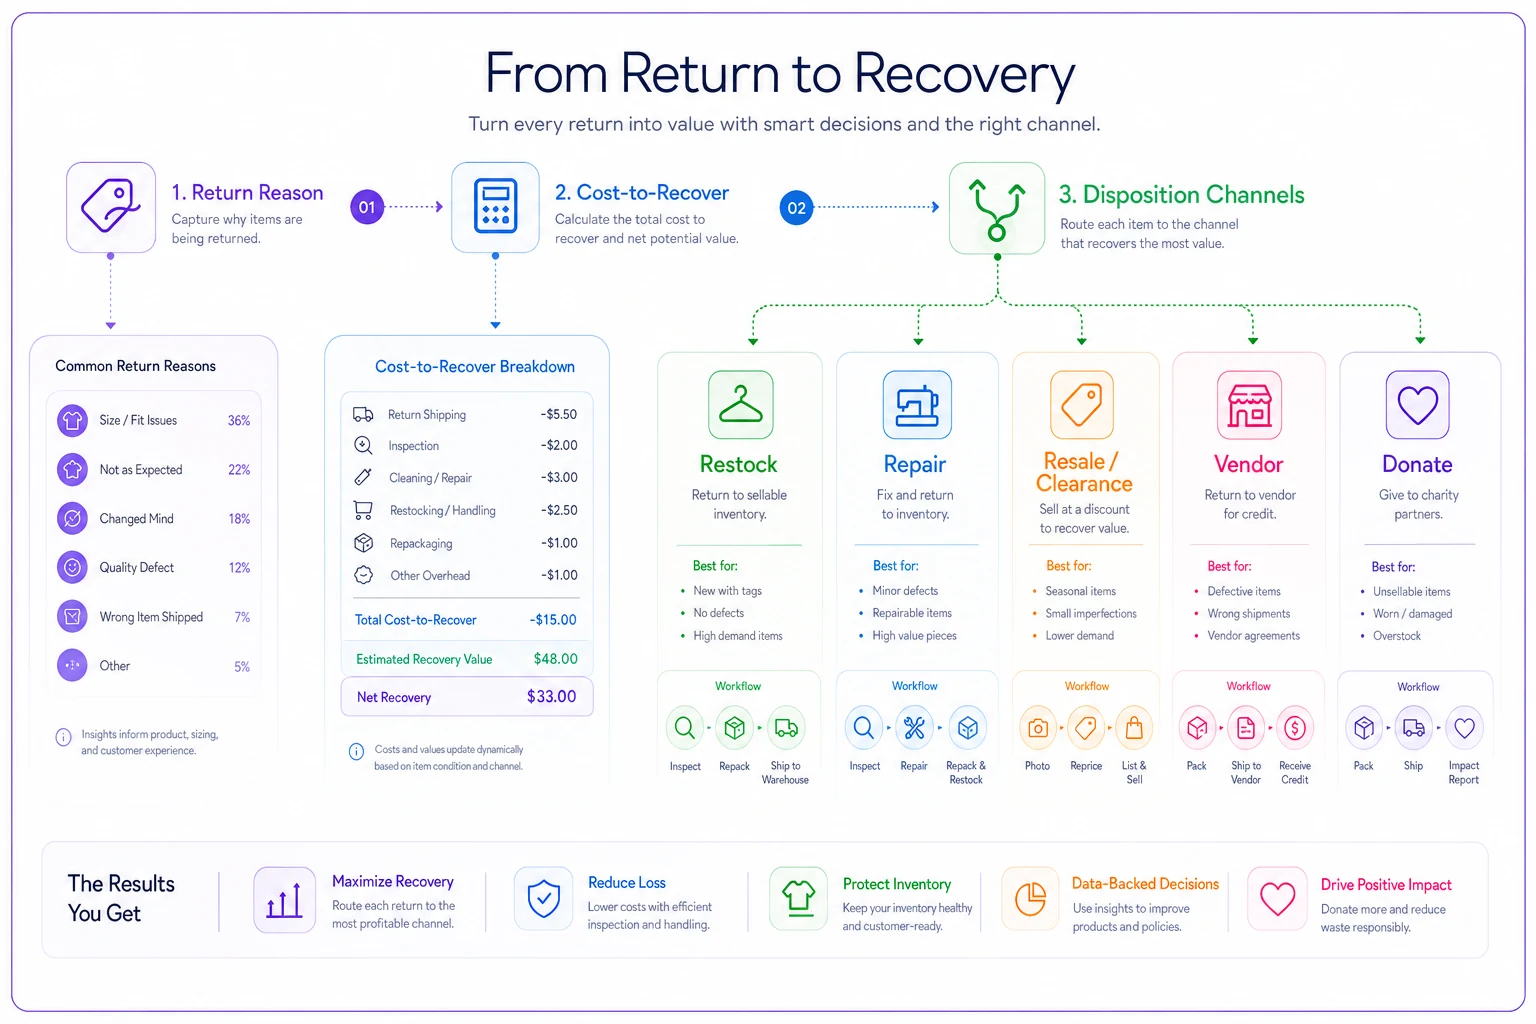
Here's the disposition channel set most apparel shops actually need:
-
Restock — item is sellable as-is, goes back to the floor at full price
-
Repair — minor fix needed (button, hem, steam, spot clean) before restock
-
Resale/clearance — can't go back at full price, sells at markdown or on a secondary channel
-
Vendor — defective or damaged on arrival, returned to supplier for credit
-
Donate/liquidate — recovery cost exceeds any realistic resale value
The mistake almost everyone makes: they let the refund decision and the disposition decision collapse into one. The customer gets their money, the item goes on the "to restock" pile, and nobody asks whether that item should've gone to vendor credit or straight to clearance. That single collapse is where most of the hidden loss lives.
If you haven't built the routing logic yet, the decision tree in a compact returns-routing SOP is the operational companion to the money math here. This post tells you what each path costs. That one tells your staff how to pick the path.
What a return actually costs
Put real numbers on a single returned item so the model is concrete. Say it's a $78 retail top, cost $31, so your original gross margin was about $47.
| Cost component | Restock | Repair | Resale/clearance | Vendor return | Donate |
|---|---|---|---|---|---|
| Inspect + handle labor | ~$2.50 | ~$2.50 | ~$2.50 | ~$3.50 | ~$1.50 |
| Re-tag / re-hang | ~$1.00 | ~$1.00 | ~$1.00 | — | — |
| Repair / cleaning | — | ~$6–10 | — | — | — |
| Inbound shipping (if online) | ~$7–9 | ~$7–9 | ~$7–9 | ~$7–9 | ~$7–9 |
| Non-refunded processing fee | ~$2.30 | ~$2.30 | ~$2.30 | ~$2.30 | ~$2.30 |
| Margin lost to markdown | $0 | $0 | ~$20–30 | n/a | full cost ($31) |
| Vendor credit recovered | — | — | — | +$25–31 | — |
| Net cost of the return | ~$6–15 | ~$13–25 | ~$26–44 | net slightly positive to -$5 | ~$42+ |
A few things jump out when you lay it out like this.
First, an in-store restock is cheap — call it $6 if the item's genuinely perfect. An online return of the same item starts at $15 before any markdown, because of shipping and the processing fee you rarely claw back. That gap alone should change how you think about online return policies versus in-store.
Second, the donate channel is your most expensive outcome, not your cheapest. People treat donation as the easy "just get rid of it" option, but you're eating the full product cost plus handling. Donation should be the deliberate floor you hit only when every other channel costs more — not a default for anything that looks tired.
Third, vendor returns are the only channel that can come out ahead, and they're the one small shops underuse the most. If an item came back because it was genuinely defective, that's vendor credit you're entitled to — and most shops don't log defects cleanly enough to ever claim it.
Worked P&L: a single-store shop
Picture a one-store operation doing roughly $540k a year, maybe 60% of that in-store and 40% online. Blended return rate sits around 22% on the online side and about 8% in-store — typical for apparel.
Rough monthly return volume: around 180 returns, maybe 120 of them online.
If every return gets the lazy treatment — inspect quickly, restock by default, refund in full, processing fee eaten — your blended cost per return lands near $18. That's roughly $3,200–$3,400 a month, close to $40k a year, flowing out through labor, shipping, fees, and the markdowns on items that quietly went stale on the "to restock" pile.
Now route them deliberately:
-
About 55% genuinely restock clean → ~$6–10 each
-
About 15% need a quick repair or steam → ~$15 each
-
About 12% go to clearance instead of sitting at full price pretending they'll sell → ~$32 each, but they actually move
-
About 8% are defects that go back to the vendor for credit → net near zero
-
About 10% donate → ~$42 each
Blended cost per return drops to roughly $13. Same volume, same customers — but about $900 a month back, and the clearance items actually sell instead of aging into dead stock. The savings aren't glamorous. They're the kind that compound because you stopped letting returned product rot in the wrong channel.
What breaks when you add stores
At one store, the person inspecting the return is often the person who'll restock it, so the disposition decision is at least consistent — even if it's consistently wrong. At three stores, you get three different people making routing calls with no shared standard. One store's "restock" is another store's "clearance." Defects get restocked at Store B because nobody there knows the vendor-return process. Clearance product piles up at Store A because that's where returns physically land.
A three-store setup doing roughly $1.5M combined might process 480–520 returns a month. The cost-per-return spread between your tightest location and your sloppiest will be wider than you expect — something like $11 at one versus $21 at the other. That's not a people problem. It's a routing-consistency problem.
The failure points that show up at multi-store scale:
-
Defects never get credited because no single store owns the vendor-return log
-
Returned-to-floor items get double-handled when they're returned at one store but belong to another's inventory
-
Clearance decisions lag because nobody has authority to mark down returned product, so it sits at full price looking unsold
-
The P&L can't separate stores so you can't tell which location is bleeding on returns
The fix isn't more staff. It's a shared disposition standard plus one place where every return's reason, cost, and channel gets logged the same way. Whether that's a shared spreadsheet or an operational platform, the routing rule has to live outside any one person's head. AI-assisted operational software can help here — flagging a scanned return as "vendor-defect, log for credit" or "online return, route to clearance" based on reason codes, so the call doesn't depend on which associate happens to catch it. Not flashy. Just consistent, which is the thing multi-store setups lose first.
Policy levers you can actually test
Once the cost model exists, policy stops being about customer-service vibes and becomes math.
Tiered refunds. Not every return deserves identical treatment. A full refund makes sense for genuine fit or defect issues. For change-of-mind returns on final-markdown items, store credit instead of cash preserves the sale and dodges the processing-fee loss. The lever to test: what share of change-of-mind returns can shift to credit without hurting repeat purchase?
Restocking deposits on high-return categories. Some categories — occasion wear, structured outerwear, anything fit-sensitive — return at double the shop average. A modest deposit on these specific items filters out the serial bracketing behavior (buy three sizes, keep one) that inflates online return costs. Apply it surgically by category, never store-wide.
Final-sale windows on deep markdowns. Items already at 50%+ off shouldn't be eligible for refund — the margin's gone and a return just adds handling cost on top. This one's almost free to implement and cuts a surprising slice of the most expensive returns.
Free in-store returns on online orders. Counterintuitive, but it works: steering online returns into stores drops your per-return cost from ~$15 to ~$6 by killing the inbound shipping, and puts the customer on your floor where the exchange-instead-of-refund rate climbs. You're paying a little in convenience to recover margin and traffic.
A lot of what drives return volume never reaches your returns desk at all — it's set by what the customer saw before they bought. The product-page fixes in why most product pages cause apparel returns attack the front end; the policy levers here manage the economics of the returns that happen anyway.
KPI gates that tell you a policy is working
Policies drift. Staff get generous, markdown decisions lag, defects stop getting logged. You need gates — thresholds that trip a review rather than numbers you admire monthly.
A practical gate set:
-
Cost-per-return stays under your target band (e.g., $13 blended). Breach → audit disposition mix.
-
Restock-channel share sits where it should (~50–60%). If it climbs past ~70%, someone's restocking items that should've gone to clearance or vendor.
-
Vendor-credit capture rate — of items flagged defective, what % actually got credited? Under 70% means money's leaking.
-
Clearance aging — returned items marked clearance should sell within ~30 days. If they're sitting, your markdown depth is wrong.
-
Online-to-store return conversion — if you're pushing in-store returns, track what share actually comes in-store.
The gate that catches the most is usually restock-channel share. When it creeps up, it almost always means product is going back to the floor that shouldn't, which shows up a month or two later as unexplained markdowns. Better to catch it at the returns desk than in next quarter's margin report.
Copy-paste spreadsheet tabs to test it yourself
You don't need special tooling to run this model. Four tabs get you to decisions.
Tab 1 — Return Log. One row per return. Columns: date, store, SKU, retail price, unit cost, return reason (code), disposition channel, inspect labor, repair cost, shipping, processing fee not refunded, vendor credit recovered. One formula column: net cost of return.
Tab 2 — Cost-to-Recover Rates. A small reference table of your standard per-channel costs (the table above, with your real numbers). Tab 1 pulls from here so you're not re-entering costs per row.
Tab 3 — Disposition Mix. A pivot off Tab 1: count and total net cost by channel, and by store. This is where multi-store cost-per-return gaps become visible.
Tab 4 — Policy Simulator. Clone your disposition mix, then let yourself change assumptions — shift X% of online returns to in-store, move Y% of change-of-mind to store credit, apply a deposit to one category — and watch the blended cost-per-return move.
Use data validation dropdowns for disposition channels so entries stay consistent and your pivots don't break.
Here's the simple process to run it the first time:
-
Log every return for 30 days with real costs, not estimates
-
Build the disposition mix — look at where product is actually going
-
Find your most expensive channel share and your biggest between-store gap
-
Run two or three policy changes through the simulator
-
Pick the one lever with the best cost impact and least customer friction
-
Re-check against your KPI gates after 60 days
This is the tab that turns policy arguments into a number.
When this is worth building — and when it isn't
Worth it if: you're running more than ~120 returns a month, you have online volume, or you're at two-plus stores where routing consistency is slipping. The payback shows up fast because returns are a high-frequency, repeatable cost.
Not worth the full build if: you're a single small store doing low online volume and under ~50 returns a month. Your total return cost might not justify a four-tab model — just fix the obvious stuff (final-sale on deep markdowns, log your defects for vendor credit) and move on.
Who should skip the aggressive levers entirely: newer shops still building repeat customers. Restocking deposits and tight refund tiers can cost you more in lost loyalty than they save in handling. Get your return reasons clean first, fix the upstream causes, and only add friction once you know a category genuinely abuses the policy.
The real scenario
A two-store women's apparel shop, roughly $820k combined, was running what felt like a normal 20% online return rate and treating returns as pure overhead. No separate cost tracking. Everything restocked by default; defects almost never sent back for credit.
Thirty days of logging showed the actual picture: blended cost-per-return around $19, a restock-channel share near 78% — way too high, meaning items were going back to the floor and then quietly getting marked down — and a vendor-credit capture rate of basically zero because nobody logged defects.
They changed three things. Final-sale on anything past 50% off. A standing vendor-return log so defects actually got credited. And steering online returns into stores with free in-store returns.
Over the next couple of months, cost-per-return settled around $13, vendor credits started recovering a few hundred dollars a month that used to be a total loss, and — the part they didn't expect — in-store returns drove enough exchange-instead-of-refund behavior that returns stopped feeling like pure bleed.
Nothing dramatic. Just a line item that went from invisible and leaking to measured and managed. Returns in apparel aren't a problem you eliminate. They're an economic flow you route. The shops that treat routing as a cost model — reason, recovery, channel — stop losing margin in the pile of product that came back and never found its right home.
Nothing dramatic. Just a line item that went from invisible and leaking to measured and managed. Returns in apparel aren't a problem you eliminate. They're an economic flow you route. The shops that treat routing as a cost model — reason, recovery, channel — stop losing margin in the pile of product that came back and never found its right home.
Ready to elevate your apparel business?
Join 2,000+ retailers using Werzly to streamline operations, increase sales, and deepen customer loyalty.