


Three weeks ago, a boutique owner in Charlotte showed me her buying spreadsheet. She had columns for wholesale cost, retail price, and that was it. No sell-through targets. No markdown triggers. No carrying cost calculations. Just vibes and hope.
She'd been running her store for four years.
This isn't unusual. Most small apparel stores operate without clear thresholds for when to buy more, when to mark down, and when to move stock between locations. They react to empty racks and overflowing stockrooms instead of working from actual decision rules tied to their real economics.
The problem gets worse when you run multiple locations. What looks like healthy inventory at Store A might be bleeding cash when you factor in Store B's dead stock and Store C's constant stockouts of the same SKU. Without a system that connects sell-through rates to specific actions, you're guessing with your biggest expense category.
Why traditional retail metrics fail small apparel stores
Big retailers have category managers running weekly WSSI reports and markdown optimization algorithms. Dedicated inventory planners calculating weeks of supply. Vendor matrix buying handled by entire teams.
Small apparel stores? You're checking last month's sales, eyeballing your floor, and hoping your gut instinct about that new vendor holds up.
Traditional retail P&L frameworks assume resources that simply don't exist at the small store level. You don't have a merchandising analyst. You can't dedicate someone to inventory planning. You're probably doing your buying between customer interactions on a Tuesday afternoon.
Without clear thresholds, every inventory decision becomes emotional. That jacket that's been sitting for 8 weeks? You'll mark it down "soon." The bestseller that sold out last week? You'll reorder "when you have time." Meanwhile, gross margin slowly erodes from holding costs, emergency transfers, and panic markdowns.
The real cost structure most stores ignore
Here's what actually drives profitability in small apparel retail:
Take control of your clothing store operations.
Werzly helps you manage stock, process orders, and engage customers effortlessly.
- Unified inventory and order management
- Automated customer notifications
- Sales and stock analytics
No credit card required
Direct costs everyone tracks:
-
Wholesale cost
-
Freight and duties
-
Initial markup
Hidden costs that quietly destroy margins:
-
Carrying cost at 2-3% monthly (space, capital, insurance)
-
Transfer costs between stores ($15-40 per box)
-
Markdown erosion (average 35% off wipes out most of your margin)
-
Opportunity cost of dead inventory slots
A $60 wholesale dress marked up to $148 looks great on paper. Hold it four months and you've added roughly $7 in carrying costs. Transfer it between stores twice and add another $25. Mark it down 40% to finally move it and you're selling at $89 with total costs around $92.
You just lost money on a dress with "60% initial markup."
Building decision thresholds from actual unit economics
The solution isn't complex formulas. It's simple thresholds built on your real numbers.
Start with your baseline metrics:
-
Target GM% after all markdowns (usually 48-55% for small apparel)
-
Monthly carrying cost (typically around 2.5% of inventory value)
-
Average markdown depth when needed (usually 30-40% off)
-
Transfer cost per unit (depends on packaging, often $2-5 per piece)
From these, you can calculate specific triggers.
Markdown trigger formula
If an item hasn't hit X% sell-through by Y weeks, a markdown is mathematically required to protect your target margin.
-
Week 4
Need 25% sell-through or take 20% markdown
-
Week 8
Need 50% sell-through or take 35% markdown
-
Week 12
Need 75% sell-through or take 50% markdown
These aren't arbitrary. They're based on carrying cost accumulation versus margin preservation from moving inventory before it becomes genuinely dead.
Reorder trigger formula
Reorder point = (Daily sales rate × Lead time) + Safety stock based on sales variance
For small stores, simplify it: reorder when stock hits 3 weeks of current sales rate plus one week buffer. This prevents both stockouts and overordering, which are equally expensive in different ways.
Transfer trigger formula (multi-store)
Transfer when:
-
Store A has more than 8 weeks of inventory at current rate
-
Store B has less than 2 weeks
-
Transfer cost is less than 5% of retail value
-
Items aren't within 4 weeks of markdown threshold
That last point matters. Transferring slow-movers between stores hoping for different results is one of the most common and costly mistakes in multi-location retail.
Single store threshold system with real numbers
An actual example from a single-location boutique doing around $78k monthly:
Store Profile:
-
Average transaction
$95
-
Monthly sales
820 transactions
-
Inventory value
$124,000 retail
-
Turn rate
3.8x annually
-
Rent
$4,200/month
Category: Premium Denim
-
Wholesale
$42
-
Retail
$98
-
Initial margin
57%
-
Target GM% after markdowns
48%
Here's how the decision timeline plays out:
Week 1-2: Full price only. Watch daily sales.
Week 3: Check sell-through. Below 15%? Add to feature wall. Carrying cost so far: roughly $2.
Week 4: Decision point. Below 25% sell-through — mark down 20% to $78. New margin sits at 46%, still above target after carrying costs.
Week 6: Still below 40% sold — mark down 30% to $69. Margin is now 39% and break-even is approaching.
Week 8: Final push — mark down 40% to $59. Margin drops to 29%. Move remaining units or accept the loss.
Every two weeks of holding costs roughly 5% of margin. Your markdown calendar needs to accelerate faster than your carrying costs accumulate. That's the core logic.
| Week | Sell-through Target | Markdown if Below | Margin After Markdown | Decision Logic |
|---|---|---|---|---|
| 2 | 15% | None | 57% | Monitor only |
| 4 | 25% | 20% | 46% | Preserve margin |
| 6 | 40% | 30% | 39% | Aggressive move |
| 8 | 60% | 40% | 29% | Clear inventory |
| 10 | Any | 50% | 19% | Salvage value |
These numbers came from an actual boutique's 2024 data. Following these thresholds instead of making emotional markdown decisions cut their dead stock by around 60%.
Three-store threshold system and transfer economics
Multi-location retail adds complexity that breaks most small operators. You're not just managing inventory — you're managing inventory allocation across locations with different sales velocities and customer profiles.
A real three-store example from a small chain in North Carolina:
Store Network:
-
Store A (Downtown)
$112k monthly, higher price point
-
Store B (Mall)
$87k monthly, younger demographic
-
Store C (Suburbs)
$64k monthly, conservative styles
The coordination problem:
A batch of 48 blazers arrives. The instinct is to split them 16/16/16. That's almost never right.
Better allocation using sell-through data:
-
Store A
4.2 units/week velocity
-
Store B
2.8 units/week velocity
-
Store C
1.9 units/week velocity
Initial allocation: 20/16/12
After 2 weeks:
-
Store A sold 8 (on track)
-
Store B sold 2 (below plan)
-
Store C sold 5 (above plan)
Transfer decision matrix:
| From Store | Units Held | Weeks Supply | To Store | Transfer Cost | Action |
|---|---|---|---|---|---|
| B | 14 | 7 weeks | C | $28 | Transfer 6 units |
| B | 8 | 4 weeks | — | — | Hold |
| A | 12 | 2.8 weeks | — | — | Reorder trigger |
The transfer from B to C works because the $28 transfer cost breaks down to $4.67 per blazer on a $148 retail item — that's about 3% of retail. Store C moves them in 2 weeks versus Store B's 7, which saves roughly 10 weeks of carrying costs worth around $21 per unit.
Monthly decision calendar:
-
Week 1
Receive and allocate based on velocity data
-
Week 2
First sell-through check, minor adjustments
-
Week 3
Transfer decisions and executions
-
Week 4
Markdown review and implementation
This rhythm prevents the typical pattern of Store A constantly running out while Store B slowly accumulates dead stock.
Software automation that actually helps
Most inventory systems track what you have. They don't tell you what to do about it.
Traditional retail software for small stores assumes you have time to run reports, analyze data, and make dozens of micro-decisions daily. You don't. You're probably checking inventory while eating lunch at your desk.
Modern operational platforms can automate these threshold decisions. Instead of manually checking sell-through rates, the system flags items approaching markdown triggers. Instead of guessing at transfer opportunities, it surfaces misallocated inventory across stores before it becomes a problem.
The shift is from reactive to systematic. A proper KPI framework feeds into automated threshold monitoring. Your markdown calendar executes based on actual sell-through data rather than gut feel.
AI-powered operational software helps by calculating real-time sell-through against your thresholds, generating transfer recommendations based on velocity differences, adjusting markdown timing based on seasonal patterns, and alerting you to reorder points before stockouts hit.
Automate threshold alerts so you can act on flagged items instead of hunting for them.
But the real value isn't the automation itself. It's having consistent decision rules that remove emotion from inventory management.
Common threshold mistakes that tank margins
Setting universal markdowns across all categories
Basics and fashion items age at completely different rates. Basics might hold value for 12 weeks. Fashion items start dying at week 6. One threshold system doesn't fit both.
Ignoring size curve degradation
Once you've sold through all the mediums and larges, those remaining XS and XXL pieces need aggressive markdowns. Holding them waiting for the right customer is just carrying cost accumulation with extra hope mixed in.
Transfer paralysis in multi-store operations
Stores hoard inventory thinking they might need it. Meanwhile, another location is losing sales from stockouts. Every week of misallocation costs margin at one end and sales at the other.
Using last year's thresholds
Rent went up 8%. Shipping costs increased 15%. Thresholds from 2023 don't reflect 2024 economics. Recalculate quarterly or watch your margins erode in ways that are hard to diagnose.
Focusing on initial markup instead of realized margin
A 65% initial markup means nothing if you're marking down 60% of inventory by 40%. Your decision flow for slow-movers needs to factor in realistic sell-through, not optimistic projections.
Building your own threshold system
Start simple. Don't try to optimize everything at once.
Phase 1: Basic thresholds (Month 1)
-
Calculate your true carrying cost (rent + insurance + capital cost ÷ inventory value)
-
Set three markdown points
20% off, 35% off, 50% off
-
Assign week triggers
Week 4, Week 6, Week 8
-
Track manually for one month
Phase 2: Category refinement (Months 2-3)
-
Separate basics from fashion items
-
Adjust triggers based on actual sell-through data
-
Add reorder points for top sellers
-
Document what's working
Use this rollout flow:
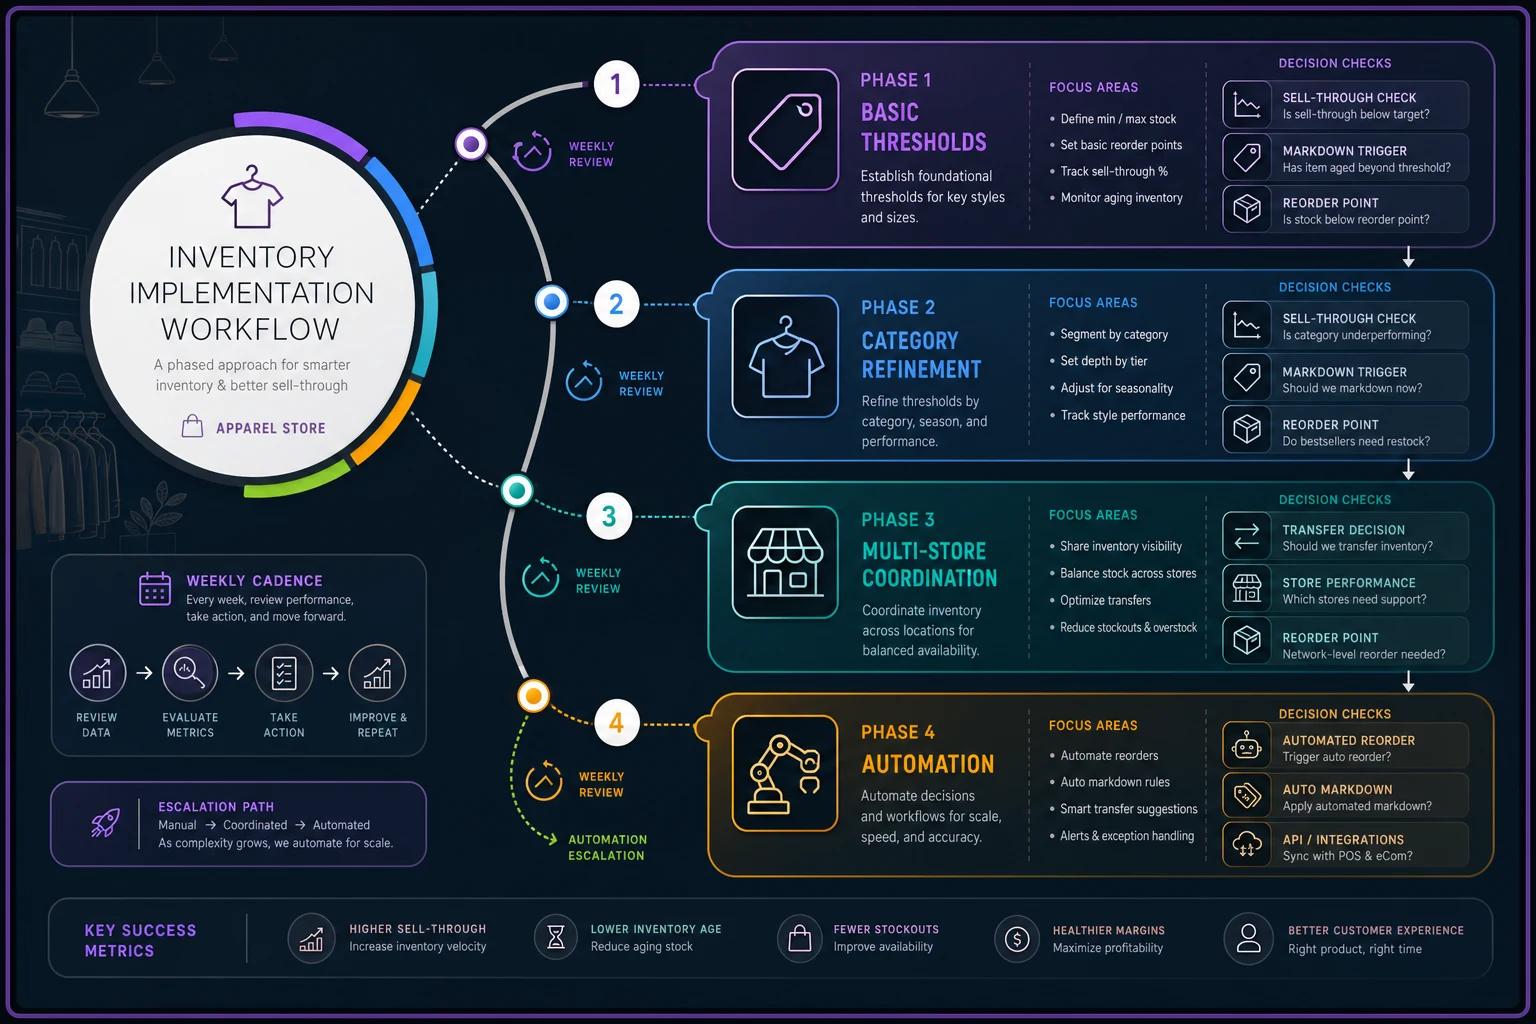
Phase 3: Multi-store coordination (Month 4+)
-
Map velocity differences between stores
-
Set transfer triggers based on weeks-of-supply gaps
-
Build transfer costs into your decision matrix
-
Create monthly transfer windows
Phase 4: Automation and optimization
-
Move from spreadsheets to systematic tracking
-
Automate threshold alerts
-
Build predictive models from historical patterns
-
Integrate with buying decisions
The boutique owner from Charlotte implemented Phases 1 and 2 over about eight weeks. Dead stock dropped from 31% to 18% of inventory. More importantly, realized gross margin increased by 4 percentage points — because she was marking down earlier but less deeply.
The difference between thriving and surviving
Retail P&L and inventory economics for small apparel stores isn't about complex formulas or expensive systems. It's about translating basic math into consistent decision rules you actually follow.
The stores that make it through the next few years won't necessarily have the best buyers or the trendiest products. They'll be the ones that turn inventory reliably, preserve margin systematically, and make decisions from thresholds rather than feelings.
Every week you hold dead inventory is a week you can't buy something that would actually sell. Every markdown you delay is margin disappearing to carrying costs. Every transfer you don't make is a missed sale at one store and wasted space at another.
The math is unforgiving. But it's also clarifying. Once you have clear thresholds, inventory decisions become operational tasks instead of existential debates.
Stop agonizing over individual items. Build thresholds that reflect your actual economics. Follow them consistently. Successful retail isn't about having perfect products — it's about moving inventory at the right pace to maintain margins while serving customers well. The math is straightforward. The only question is whether you'll build this before your margins force you to.
Retail P&L and inventory economics for small apparel stores isn't about complex formulas or expensive systems. It's about translating basic math into consistent decision rules you actually follow.
Stop agonizing over individual items. Build thresholds that reflect your actual economics. Follow them consistently. Successful retail isn't about having perfect products — it's about moving inventory at the right pace to maintain margins while serving customers well. The math is straightforward. The only question is whether you'll build this before your margins force you to.
Ready to elevate your apparel business?
Join 2,000+ retailers using Werzly to streamline operations, increase sales, and deepen customer loyalty.