


Most small apparel shops don't lose margin because of one bad decision. They lose it because four separate decisions—what to buy, when to mark it down, how much to trust a supplier's ship date, and how returns eat into a category—are each made in their own corner of the business, by their own person, using their own spreadsheet. Each one looks reasonable on its own. Stacked together, they quietly bleed the P&L.
What nobody tells you when you open a second rack or a second store is that these decisions aren't independent. A late shipment changes your markdown timing. A high return rate on one silhouette changes what "good sell‑through" even means for that category. A supplier who runs two weeks late every spring changes how much reserve cash you need before you commit to the fall buy. When these get managed as separate problems, you end up with a store that's technically organized and still slowly losing money.
This article is about stitching those pieces into one decision engine—a single artifact you can run on a spreadsheet and a short weekly meeting—so that buying, markdowns, transfers and supplier risk all pass through the same P&L‑safe gates before any money moves.
Why the pieces drift apart in the first place
The drift is structural, not sloppy. Here's how it usually plays out.
The owner (or whoever owns buying) tracks sell‑through in one tab. The person handling returns has their own log, usually tied to whatever the POS exports. Supplier lead times live in somebody's head or in email threads. Pricing and markdown calls get made on gut, often during a slow Tuesday when the floor looks heavy.
None of that is wrong exactly. The problem is that no single number reconciles all of it. You can have a jacket showing 65% sell‑through—which looks healthy—while that same jacket has an 18% return rate and the restock is running three weeks late. On paper it's a winner. In reality, the "sold" units are partly fiction, real available inventory is lower than the report says, and the next buy decision is being made on bad data.
-
Buying optimizes for sell‑through → over‑orders fast‑moving SKUs that also have high returns
-
Returns tries to minimize restocking cost → sends sellable units to clearance too early
-
Pricing protects full‑price margin → holds markdowns too long on supplier‑delayed goods that are now off‑season
-
Supplier management chases the lowest unit cost → tolerates variability that wrecks markdown timing
Each team wins. The P&L loses.
The core idea: gates, not reports
Most retail "systems" are really just more reports. More dashboards, more exports, more tabs. Reports describe the past. They don't stop a bad decision before it happens.
Take control of your clothing store operations.
Werzly helps you manage stock, process orders, and engage customers effortlessly.
- Unified inventory and order management
- Automated customer notifications
- Sales and stock analytics
No credit card required
A decision engine works differently. It converts your scattered data into gates—simple pass/fail thresholds that a buy, markdown or transfer has to clear before you act. The point isn't to replace judgment. It's to make sure no single function can push a decision through that quietly damages the P&L somewhere else.
Think of it as four inputs feeding one set of rules:
-
Forecast — expected demand and sell‑through velocity by category
-
Returns reality — net sell‑through after returns, by SKU family
-
Supplier variability — how reliable each vendor's lead time actually is
-
Pricing/margin floor — the lowest margin you'll accept before a decision is "no"
Those four feed three gates: a buy gate, a transfer gate, and a markdown gate. Everything routes through them. This builds directly on the logic in a retail P&L & inventory‑economics system that turns sell‑through into monthly buy/markdown thresholds—but here we're connecting those thresholds to supplier risk and returns so they stop contradicting each other.
The owner‑friendly operating dashboard
Before the gates work, you need one screen—literally one tab—where the owner can see the state of the business without digging. Not fifteen KPIs. Six, maybe seven. The test is simple: if a number doesn't change a decision, it doesn't belong on the dashboard.
Here's the layout that holds up in practice:
| Panel | What it shows | Why it's there |
|---|---|---|
| Net sell‑through | Sell‑through after returns, by category | Raw sell‑through lies when returns are high |
| Weeks of supply | On‑hand ÷ recent velocity, by category | Tells you overstock vs. stockout risk at a glance |
| Supplier reliability score | On‑time % and avg. lateness per vendor | Converts "they're usually late" into a number |
| Margin position | Current realized margin vs. floor, by category | Shows which categories are already below the line |
| Markdown clock | Days since receipt vs. markdown trigger | Flags goods aging past their protected window |
| Cash exposure | Open PO commitments vs. reserve | Keeps the buy from outrunning the bank account |
The discipline is keeping these on the same page, refreshed on the same cadence. The moment weeks‑of‑supply lives in one person's file and supplier reliability lives in another's, the engine falls apart. This is exactly the kind of workflow where AI‑assisted operational software earns its keep—it can pull POS exports, returns logs and receiving records into one reconciled view automatically, so the dashboard isn't somebody's Sunday‑night manual rebuild. But you can run the first version entirely by hand. Start manual, prove the gates work, then automate the data plumbing.
The spreadsheet tabs you can copy today
This whole thing lives in one workbook with five tabs. You don't need software to start. You need discipline and these tabs talking to each other through shared SKU and category fields.
Tab 1 — Thresholds
This is the brain. Everything else references it.
Columns:
-
Category
-
Target net sell‑through at week 4 / week 8 / week 12
-
Margin floor (%)
-
Minimum weeks of supply (stockout guardrail)
-
Maximum weeks of supply (overstock trigger)
A typical outerwear row might set week‑8 net sell‑through target at 45%, margin floor at 42%, min supply at 2 weeks, max at 10. Basics would look completely different—higher target sell‑through, lower margin floor, tighter supply bands.
Tab 2 — Supplier Variability
One row per vendor:
-
Quoted lead time
-
Actual average lead time (last 6 orders)
-
Lateness standard deviation (or just "typical days late" if stats aren't your thing)
-
On‑time %
-
Reliability tier (A/B/C)
The insight most owners miss: it's not the average lateness that hurts, it's the variability. A supplier who's always 10 days late is manageable—you plan around it. A supplier who's on time, then 3 weeks late, then early, is impossible to plan around and should carry extra reserve and earlier reorder triggers. Supplier risk belongs in your reorder timing, not just your mental notes after a bad season.
Tab 3 — Transfers
For multi‑store or pop‑up operators:
-
SKU
-
Store A on‑hand + velocity
-
Store B on‑hand + velocity
-
Transfer cost (labor + freight)
-
Projected margin recovery from the move
The transfer gate only passes when projected margin recovery clearly beats transfer cost and the receiving store's velocity supports absorbing the units before the markdown clock runs out.
Tab 4 — Markdown Gates
-
SKU family
-
Days since receipt
-
Net sell‑through vs. threshold
-
Current margin vs. floor
-
Recommended action
hold / transfer / markdown tier 1 / markdown tier 2 / clear
Tab 5 — Cash & Open POs
Columns:
-
Open PO value
-
Expected receipt dates (adjusted by supplier reliability tier)
-
Reserve on hand
-
Available‑to‑commit
This is the tab that stops the classic small‑shop mistake: committing the spring buy while winter clearance hasn't converted to cash yet.
How the gates actually run (the workflow)
Here's the weekly flow, start to finish. It takes about 30–40 minutes once the tabs are populated.
-
Refresh net sell‑through. Pull POS sales, subtract returns from the returns log, update by category. Raw numbers only mislead here.
-
Update weeks of supply against recent velocity, not seasonal averages. A category selling 8 units/week with 6 on hand is in a very different spot than the monthly report suggests.
-
Check the markdown clock. Any SKU family past its protected window that's below the net sell‑through threshold gets flagged.
-
Run the markdown gate. Below threshold AND above margin floor → transfer or tier‑1 markdown. Below threshold AND near floor → tier‑2 or clear. You never mark down purely because something feels slow.
-
Run the transfer gate for flagged SKUs before marking down—moving stock to a store that can sell it full‑price almost always beats discounting.
-
Run the buy gate against Tab 5. No PO gets committed if available‑to‑commit can't cover it after adjusting receipt dates for supplier reliability.
-
Log the decisions. One line each
what passed, what didn't, why.
A quick visual of the workflow keeps the sequence obvious.
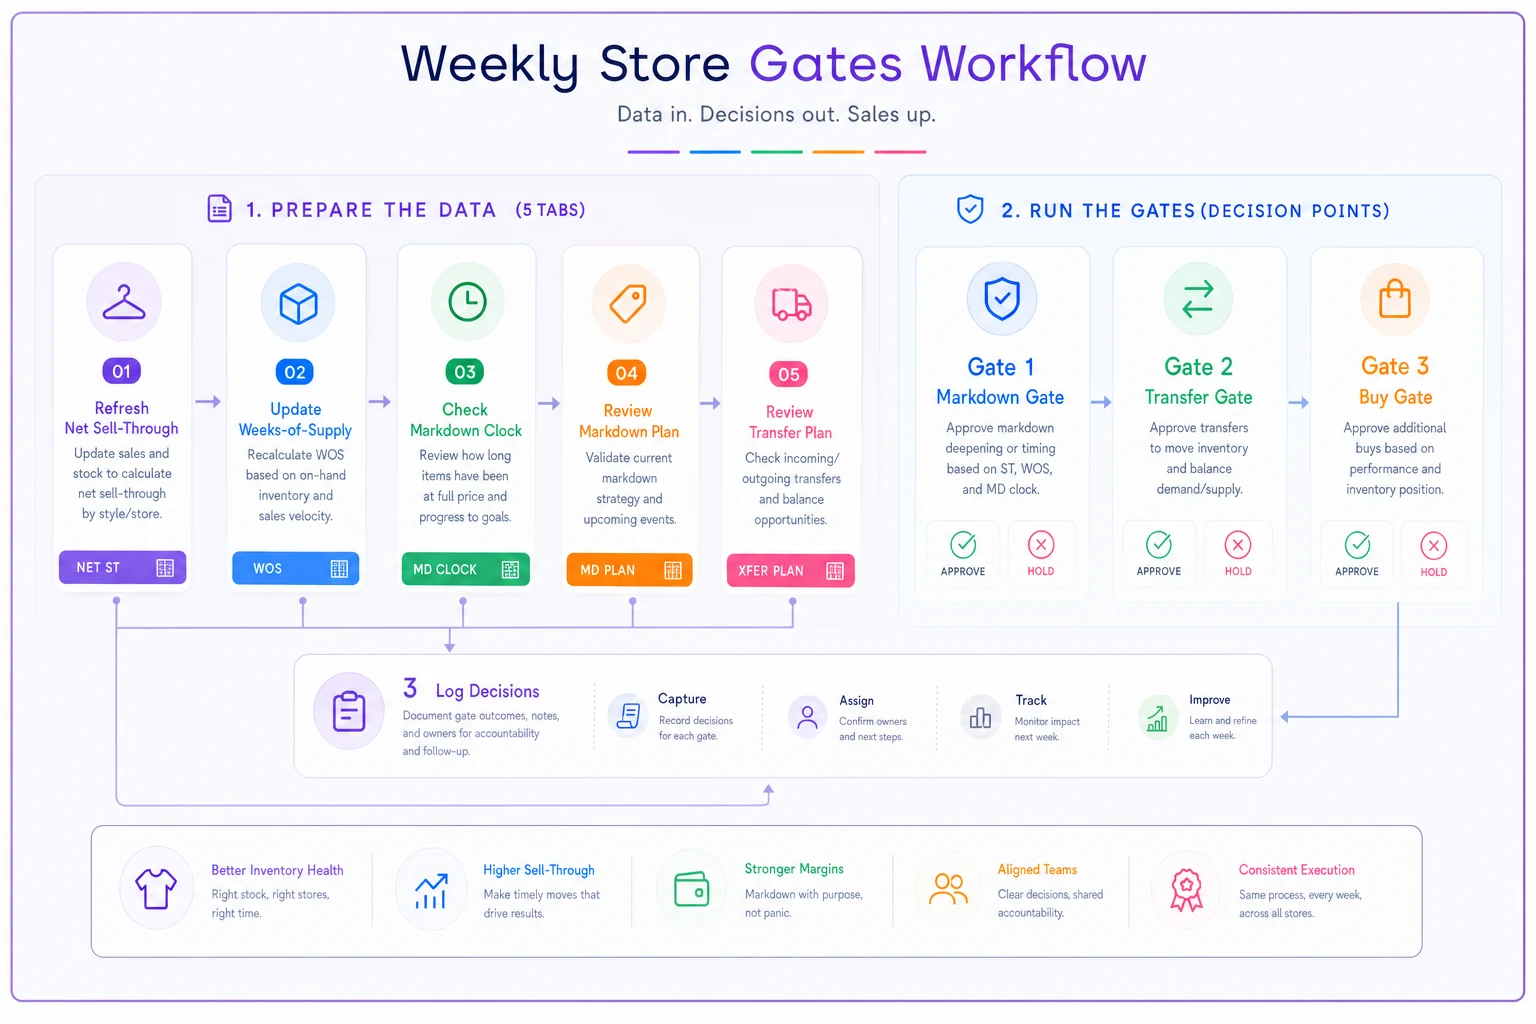
That logging step matters more than it looks. After a season you can see which gates you overrode and whether those overrides helped or hurt. That's how the thresholds get sharper over time.
A real scenario
A two‑store women's apparel shop—roughly $1.4M combined annual revenue—kept landing in the same trap every season. Strong‑looking sell‑through reports, then a brutal January and July clearance that wiped out the margin they thought they'd earned.
When they broke it apart, the pattern was obvious. Their top‑reported denim style showed around 60% sell‑through at week 8. Looked great. But returns on that fit ran around 20%, so net sell‑through was closer to 48%. Meanwhile their main denim vendor was quoting 6 weeks and actually delivering in 8–9, unpredictably. So restocks landed late, into a selling window that was already narrowing, and the "winner" kept getting reordered on inflated numbers.
They built the five tabs. First real change: measuring net sell‑through, which immediately reclassified two "hero" styles as average performers. Second: they tiered suppliers, and the unreliable denim vendor got earlier reorder triggers plus a small reserve buffer. Third: markdowns stopped being a gut call and started running through the gate.
Over the next two seasons, clearance markdowns dropped from somewhere in the $55k–$60k range down to the high‑$30k range, and end‑of‑season margin stopped getting ambushed. Nothing dramatic month to month—just fewer bad buys compounding, and markdowns happening on the right SKUs at the right time instead of in a panic.
The 30/60/90 adoption plan
Don't try to stand this up all at once. It fails when owners attempt all five tabs and the dashboard in week one.
Days 1–30 — Make the data honest.
-
Build the Thresholds tab for your top 4–6 categories only
-
Start subtracting returns from sell‑through (even manually)
-
Populate supplier actual lead times from your last 6 orders per vendor
-
Goal
trust your net sell‑through number. Nothing else.
Days 31–60 — Turn on the gates.
-
Add the Markdown and Transfer tabs
-
Run the weekly 30‑minute review for real—markdowns and transfers now route through gates
-
Log every override
-
Goal
no markdown or transfer happens on gut alone
Days 61–90 — Close the loop with cash and buying.
-
Add the Cash & Open POs tab
-
Connect the buy gate to available‑to‑commit
-
Review your first full cycle of logged decisions and adjust thresholds
-
Goal
the buy, the markdown, and the cash position are all looking at the same reality
Once this is running smoothly by hand, automating the data refresh is where operational software pays off—reconciling POS, returns and receiving data so the dashboard rebuilds itself and you spend the 30 minutes deciding instead of assembling. But sequence matters: automate a process you already trust, not one you're still figuring out.
The buyer decision‑rights matrix (run it without analysts)
The last piece is who gets to override a gate. Without this, the engine becomes a suggestion the loudest person ignores.
| Decision | Within gate | Override allowed by | Must escalate when |
|---|---|---|---|
| Reorder within budget | Buyer | Buyer | PO exceeds available‑to‑commit |
| Reorder from C‑tier supplier | Buyer + flag | Owner | No reserve buffer in place |
| Tier‑1 markdown | Store/buyer | Store/buyer | Takes category below margin floor |
| Tier‑2 markdown / clear | Buyer | Owner | More than X% of category at once |
| Inter‑store transfer | Buyer | Buyer | Transfer cost > projected recovery |
| New vendor commitment | Owner | Owner | Always owner |
The rule underneath the whole matrix: anything that stays inside the gates can happen without a meeting. Anything that breaks a gate needs the next level up. That single principle is what lets a small team move fast on routine calls while protecting the P&L on the dangerous ones.
When this makes sense—and when it doesn't
This is worth building if: you're running more than a few hundred SKUs, you have two stores or a store plus online, or your end‑of‑season clearance keeps surprising you. The coordination problem is real at that scale and the engine pays for itself.
This is probably overkill if: you're a single small shop with a tight assortment and you already know every SKU by feel. In that case a simplified version—just the Thresholds and Markdown tabs—is plenty. Don't build infrastructure for coordination problems you don't have yet.
Who should not do this: owners who won't commit to the weekly 30 minutes. The engine isn't magic; it's a cadence. Skip the cadence and you've just built another spreadsheet nobody opens.
For stores wrestling with aging inventory specifically, pair this with the logic in slash deadstock without destroying margin, and if you want to pressure‑test how the whole system behaves under a bad season, the inventory resilience framework with stress tests and contingency rules gives you the scenarios to run against these gates.
Where this leaves you
Margin leaks in small apparel aren't usually a data problem—most shops are drowning in exports. The real issue is that the data never gets reconciled into a single decision point before money moves. Buying, returns, supplier risk and pricing each tell a story, and when nobody forces those stories to agree, the P&L pays the difference quietly, season after season.
Stitching them into gates changes the default. Instead of four people each making locally reasonable calls, you get one shared reality that every decision has to clear. You don't need an analyst and you don't need to start with software. You need five connected tabs, one honest dashboard, a 30‑minute weekly habit, and a clear rule about who can break a gate. Get that running, trust it for a couple of cycles, and then let automation take over the data assembly so you can spend your attention on the decisions that actually move margin.
Margin leaks in small apparel aren't usually a data problem—most shops are drowning in exports. The real issue is that the data never gets reconciled into a single decision point before money moves. Buying, returns, supplier risk and pricing each tell a story, and when nobody forces those stories to agree, the P&L pays the difference quietly, season after season.
Stitching them into gates changes the default. Instead of four people each making locally reasonable calls, you get one shared reality that every decision has to clear. You don't need an analyst and you don't need to start with software. You need five connected tabs, one honest dashboard, a 30‑minute weekly habit, and a clear rule about who can break a gate. Get that running, trust it for a couple of cycles, and then let automation take over the data assembly so you can spend your attention on the decisions that actually move margin.
Ready to elevate your apparel business?
Join 2,000+ retailers using Werzly to streamline operations, increase sales, and deepen customer loyalty.