



Most small apparel owners already know their total store P&L. They can tell you revenue, COGS, rough margin, and whether last month felt good or bad. What almost nobody can tell you quickly is which categories carried the store and which ones quietly bled margin while looking fine on the sales report.
That gap is where a category P&L review earns its keep. Not a quarterly deep-dive that takes two days and never gets repeated. A lightweight monthly program — same template, same thresholds, same decisions — that anyone on your team can run in under an hour once it's built.
This is the part people skip. A single good analysis changes one buy. A repeatable monthly review changes how the whole store allocates money, floor space, and attention across an entire year.
Why store-level P&L hides your real problems
The pattern that keeps showing up in small apparel shops: the store does $40k–$60k a month, margin looks "okay," and the owner assumes the mix is roughly healthy. Then you split it by category and the picture falls apart.
A typical example. Denim is pulling a 58% maintained margin and turning fast. Dresses look great on gross sales but after markdowns and a 22% return rate the category is netting closer to 31%. Accessories barely move but take up a third of your prime front-table real estate. At the store level, these three average out into a number that feels fine — and that averaging is exactly what lets the weak categories survive another season.
Store-level reporting is a blended lie. Not because anyone's lying, but because averages bury the categories that are dragging. The only way to see it is to build the P&L one category at a time, every month, with the same structure so the numbers are actually comparable.
If you've already set up category roles and velocity bands, this review is where that structure actually pays off — you're attaching real dollars to each role instead of just tagging them.
What a category P&L line should actually contain
The mistake most owners make when they first try this is building a category P&L that's just "sales minus cost of goods." That's a gross margin line, not a P&L. It ignores the stuff that actually separates a winning category from a losing one.
Take control of your clothing store operations.
Werzly helps you manage stock, process orders, and engage customers effortlessly.
- Unified inventory and order management
- Automated customer notifications
- Sales and stock analytics
No credit card required
A category-level P&L for apparel needs to carry at least these lines:
-
Net sales (after discounts, not list price)
-
COGS (landed cost, including freight and duties allocated)
-
Markdown dollars taken within the period
-
Returns impact — both the lost margin and the restocking/handling cost
-
Shrink allocation if you track it by zone
-
Directly attributable selling cost — the floor space and labor the category realistically consumes
That last line trips people up. You don't need perfect activity-based costing. You need a consistent rough allocation — say, floor space percentage times occupancy cost — applied the same way every month. Consistency matters more than precision here. A category that looks profitable until you load in its markdown and return drag is the whole reason to do this.
A simplified template P&L per category
A simplified template P&L per category
| Line | Denim | Dresses | Accessories |
|---|---|---|---|
| Net sales | $14,200 | $11,800 | $3,400 |
| COGS (landed) | $5,900 | $5,100 | $1,500 |
| Markdowns taken | $600 | $2,300 | $250 |
| Returns margin loss | $300 | $1,900 | $90 |
| Allocated space/labor | $1,400 | $1,600 | $1,900 |
| Category contribution | $6,000 | $900 | ($340) |
| Contribution % of sales | 42% | 8% | neg |
Look at what this surfaces. Dresses are your second-biggest sales category and your near-worst contribution category. Accessories are quietly underwater once you honestly load in the space they occupy. Nothing on a store-level report would have shown you either of those things.
Decision thresholds: keep, kill, or scale
Numbers without thresholds just create meetings. The point of the monthly review is to walk out with a decision per category, and the only way to make that fast is to agree on the thresholds before you look at the data — so you're not rationalizing in the moment.
-
Scale — contribution margin above ~30% and sell-through tracking ahead of plan. These categories get more open-to-buy next cycle and better floor position.
-
Keep / hold — contribution between roughly 12% and 30%, stable. No big moves. Watch for drift.
-
Fix — contribution 12% or below but with an identifiable cause (one bad vendor, a sizing issue driving returns, late markdowns). Gets one cycle to improve with a specific action.
-
Kill / shrink — negative contribution, or stuck in "fix" for two consecutive reviews with no improvement. Floor space reduced, open-to-buy cut, exit plan started.
The discipline that separates stores that actually improve from ones that just analyze is the two-cycle rule on "fix." A category gets exactly one month to show movement. If it's still underwater at the next review, it drops to kill — no third chance, no "let's give it one more month." That drift is how dead categories survive for a year without anyone really deciding to keep them.
This threshold logic sits downstream of your sell-through-to-markdown system — the category review is where those SKU-level signals roll up into a category-level verdict.
How the monthly review actually flows
Before getting into who feeds the review and what questions to ask, it helps to see the whole sequence in one place. The process isn't complicated, but the order matters — especially the step where thresholds get checked before anyone starts rationalizing.
-
[Pull net sales, markdowns, returns by category]
-
[Load COGS + allocated space/labor costs]
-
[Calculate category contribution %]
-
[Check against thresholds
Scale / Keep / Fix / Kill]
-
[Run buyer QA on any "Scale" decisions]
-
[Write one-page go/no-go per category]
-
[Assign actions + set next review checkpoint]
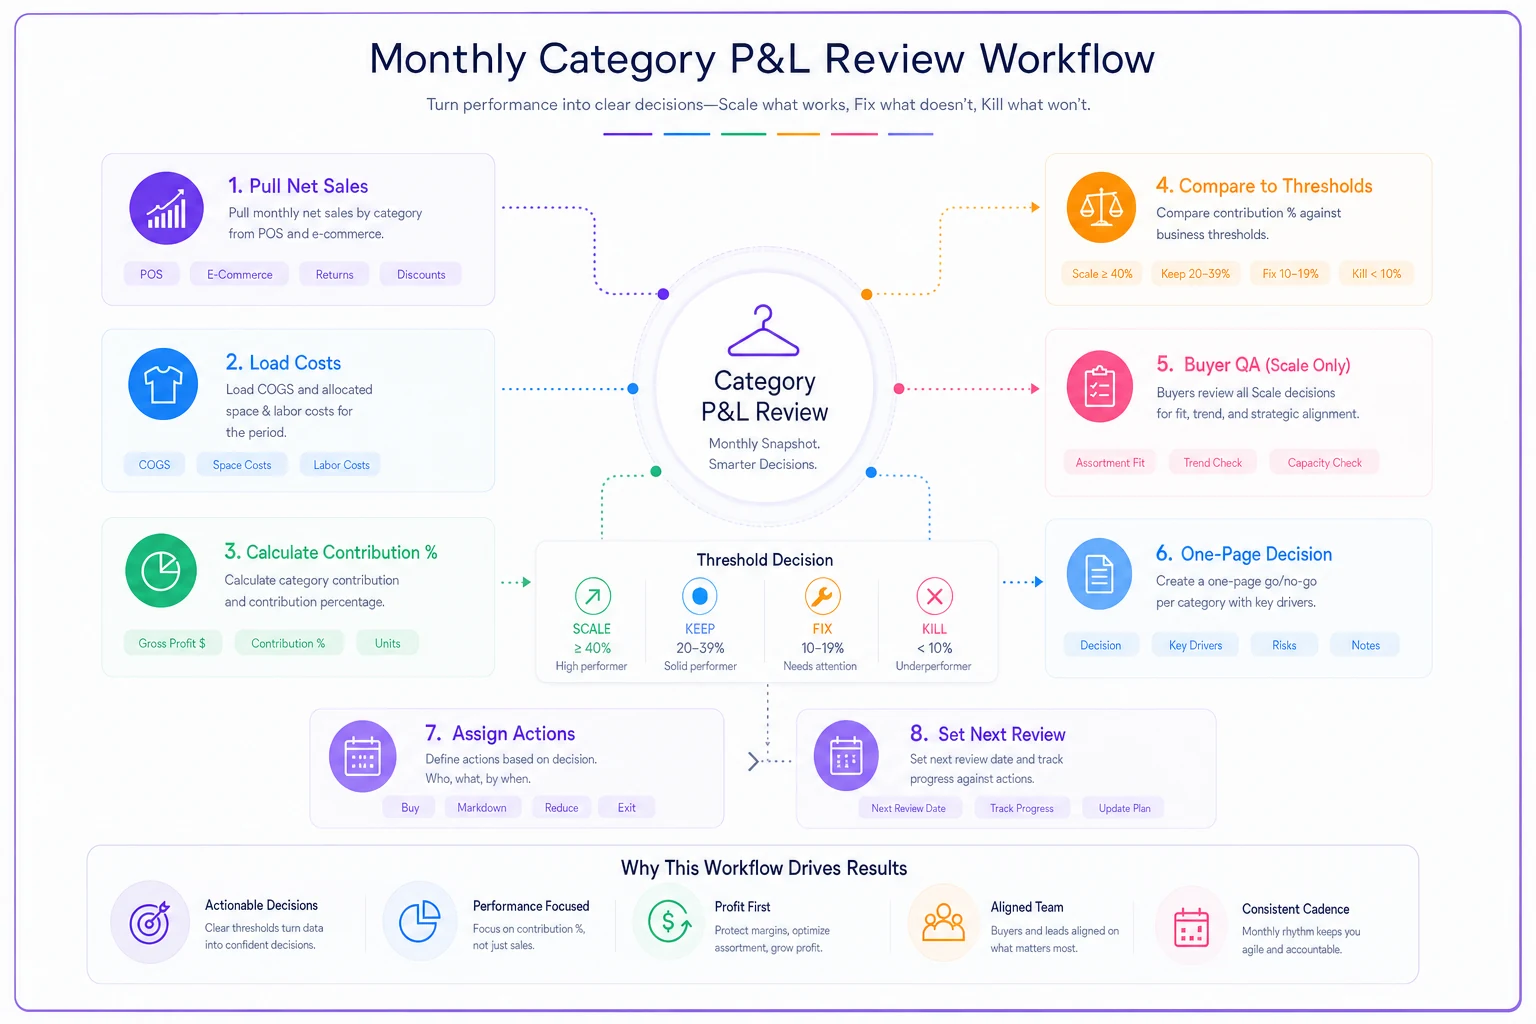
That's the whole review. Eight steps, same order every month, same template. The goal is that after two or three cycles it becomes almost mechanical — which is exactly what you want, because that's when the decisions start happening faster.
Role-level inputs: who feeds the review
A review that depends entirely on the owner pulling every number never survives a busy month. The program works when the inputs are split by role, so nobody has to do more than 15–20 minutes of prep.
Owner / buyer: supplies open-to-buy by category, incoming receipts, and any vendor issues affecting cost.
Store manager / floor lead: supplies the qualitative read — which categories are getting floor attention, what customers are asking for, where sizes are broken. This is the context that explains why a number moved.
Whoever runs POS reconciliation: supplies net sales, markdowns taken, and return counts by category. If your month-end close is already clean, this is mostly a filter on existing data, not new work.
Split inputs so no one person does more than 15–20 minutes of prep.
The reason to formalize these inputs is coordination. When the buyer and the floor lead are both looking at the same contribution number — one knows the markdowns, the other knows why those markdowns happened — you get a real decision instead of a guess. In a store where one person covers both functions, the inputs still get written down. It keeps the thinking honest even when it's the same person wearing both hats.
Short QA questions for buyer reviews
Before any "scale" decision gets more money, run it through a few quick buyer-review questions. These exist to catch the category that looks great because of a one-time event rather than a repeatable pattern.
-
Was this month's performance driven by a single hero SKU, or spread across the category?
-
Did a promotion inflate sales at the cost of margin we're now calling "scale"?
-
Is the sell-through real demand, or did we just under-buy and sell out of thin inventory?
-
Are returns trending up even though contribution looks fine this month?
-
Do we have the vendor lead time to actually scale this, or will we be chasing it too late?
That third question catches a trap worth naming. A category that sold through 90% can look like a winner — but if you only bought 40 units, you didn't win, you under-served demand and left money on the table. The QA questions keep you from scaling noise.
A one-page go/no-go template with worked numbers
Category: Dresses This month contribution: $900 (8% of net sales) Trend: down from ~14% two months ago Primary drag: returns margin loss ($1,900) + heavy markdowns ($2,300) Root cause (floor input): two vendor styles running small, driving fit returns
Thresholds check:
-
Contribution 8% → below the 12% "keep" floor → lands in Fix
-
Identifiable cause? Yes — vendor sizing on two styles.
Decision: Fix, one cycle. Actions:
-
Pull the two problem styles from reorder, mark the remaining stock for early clearance.
-
Add a fit note to those product tags and fitting-room signage.
-
Re-measure next review. If contribution isn't back above ~15%, drop to Kill and cut dress open-to-buy by a third.
Compare that to the Accessories line, which is already negative with no fixable cause — that goes straight to Kill/shrink: reduce to half the floor space, redirect it to Denim (the clear "scale" category), and stop replenishing the slow SKUs.
One page, one decision, numbers attached. That's the entire output of the review per category.
When this program makes sense — and when it doesn't
This works best for stores carrying four or more meaningful categories with enough monthly volume that the numbers aren't just noise. If you're doing $15k–$20k a month across three tight categories, a full monthly category P&L is probably overkill — a quarterly version is plenty.
It becomes almost mandatory once you're past roughly $500k–$700k annual revenue or running more than one location, because that's the point where category mix drift starts costing real money and nobody notices until a full season has passed. At that scale, the failure mode isn't one bad category — it's several categories slowly sliding while the blended store number holds steady enough that nobody raises a flag.
New stores with under six months of clean sales history should hold off. Your category data is too thin and too distorted by opening-period behavior to trust. Get your reconciliation clean first, build three or four months of solid history, then start the monthly cadence.
A real scenario
A womenswear shop doing roughly $55k–$60k a month had been running on gut feel and a store-level margin hovering around 48%. Felt fine. The owner assumed their problem categories were the obvious slow ones.
Running the category P&L for the first time flipped two assumptions. Their outerwear category — the one they were proud of — was netting single-digit contribution after late-season markdowns and a handful of expensive returns. Meanwhile a small loungewear category they'd been under-buying was contributing over 40% and selling out every month.
The decisions were unglamorous: cut outerwear open-to-buy, enforce earlier markdown timing on it, and nearly double the loungewear buy with better floor placement. Three months later the store-level margin had moved maybe two points — not dramatic on paper — but the mix was healthier, deadstock risk dropped noticeably, and they'd stopped pouring money into the category that felt like a winner but wasn't.
The number that moved most wasn't revenue. It was how fast they made buy decisions, because they finally trusted what they were looking at.
Making it stick
A program like this lives or dies on whether it actually runs every month. The reviews that survive share a few traits: the template never changes, the thresholds are agreed in advance, the inputs are split so no one person is overloaded, and the decisions are written down as go/no-go pages instead of hallway conversations that evaporate by the following week.
If your underlying data is messy — categories tagged inconsistently, returns not attributed, markdowns buried in POS — fix that layer first, because a category P&L is only as honest as the categorization feeding it. And resist the urge to track everything. Tie the review to the handful of metrics that actually change decisions, the same discipline behind cutting vanity metrics. A category contribution line and a clear threshold beat a dashboard of twenty numbers nobody acts on.
The point of a category P&L review isn't to produce a prettier report. It's to force a monthly keep/kill/scale decision on every slice of your inventory — so your money, your floor, and your attention keep flowing toward what's actually working, and away from the categories that have been coasting on a blended average all year.
Ready to elevate your apparel business?
Join 2,000+ retailers using Werzly to streamline operations, increase sales, and deepen customer loyalty.